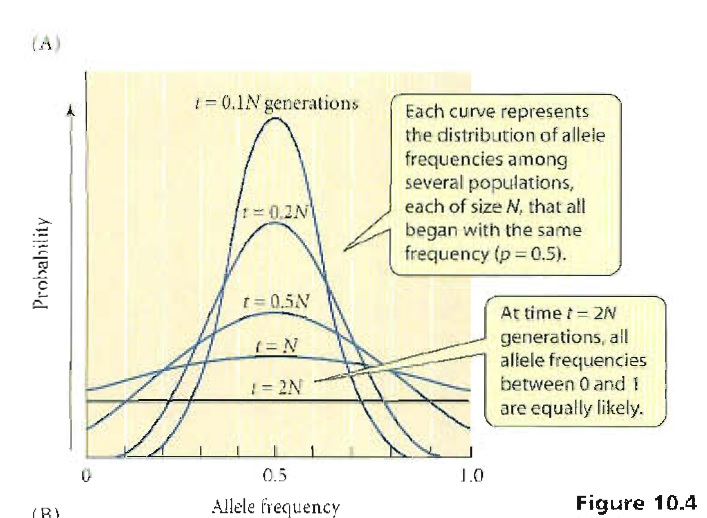
I assume that the figure comes from a section on genetic drift (since this seems likely), and it shows how the allele frequency will change over time under drift in a diploid population. So in short, each line represents the distribution of allele frequencies in different hypothetical populations, that all started with the allele frequencey p=0.5.
As for your specific questions, as the comment from @remi.b says, t is expressed as generation time since this is the relevant time scale for evolutionary changes. The reason why it is a function of population size, N, is that genetic drift acts more stongly in small populations, since it is essentially a sampling effect. You can see it as a repeated application of binomial sampling. So in small populations different populations will quicky drift away from the starting point of p=0.5, while this takes a longer time in larger populations. The effect of population size is clearly shown in this article from Nature education, where you can see the distribution of allele frequencies after one generation in populations of different sizes.
The change in allele frequencies over time under drift has been modelled by a diffussion approximation (see Kimura, 1955 for the original results). His results show that heterozygozity decreases at the rate of $1/(2N)$ per generation, and after 2N generations the distribution of allele frequencies is essentially flat (if you started at p=0.5). The degree of heterozygocity at time t is given by:
$$H_t = H_0*e^{-(\frac{1}{2N})t}$$
However, your graph does not show populations where fixation has occured (only heterozygous populations), and this proportion will increase over time in the absence of new mutations. So what is missing are bars at 0 and 1, and these will become higher as time goes by (more populations will have become fixed for one of the alleles). It should also be mentioned that these results deal with the effective population size, so $N$ is really equal to $N_e$.
As for the confusion of frequency/frequencies; the graph shows the frequency of one allele in different populations (so the allele frequency on the x-axis), but each line shows the distribution of allele frequencies in different populations. This is probably why you found this confusing.
However, your question is a bit unclear since you haven't described from where you got the graph and exactly what it is supposed to represent.

