6
$\begingroup$

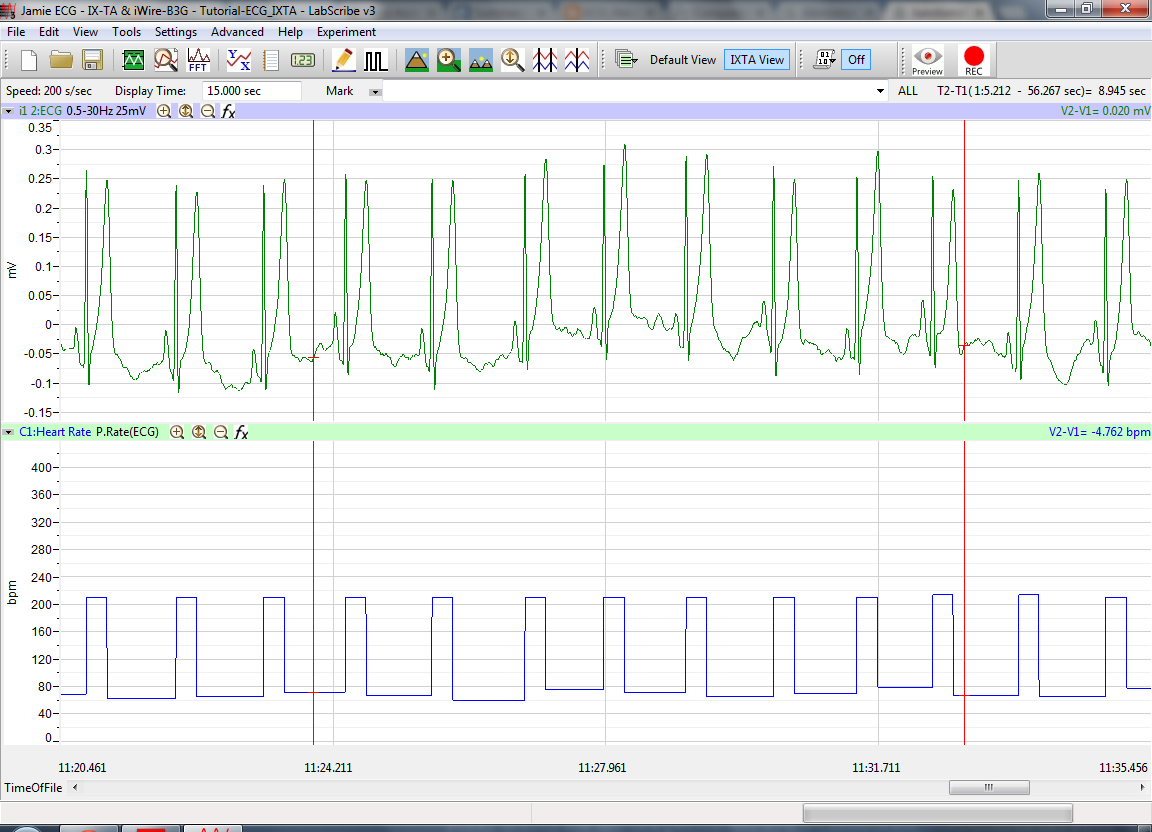
I'm getting started using ECG using a 3 lead system by iWorx. I have place the leads on my two wrists and the ground on my ankle and have recorded some data into the provided LabScribe 3 software using the ECG template. Can anyone help me interpret what I'm seeing?

ECG Recording

It doesn't look like the standard QRS I see in my textbook, but it's so regular (this is just a snippet) that I don't believe I'm seeing artifacts.

Any insight would be greatly appreciated.

Thanks!

$\endgroup$
6
  • $\begingroup$ What do you want to know? It looks fairly straightforward. Wandering baseline causing some artifact, maybe a short P-Q Interval, everything exaggerated throughout. Is this what you're asking? $\endgroup$ Commented Feb 23, 2015 at 1:50
  • 1
    $\begingroup$ it does look OK, that is P, QRS and T waves are present (means you alive). Weirdness might come from insufficient or incorrect filtering, namely, it seems that T wave is too intense. $\endgroup$ Commented Feb 23, 2015 at 1:52
  • $\begingroup$ If no one answers here, you might request admission onto the Google Plus ECG community. And post this same question there; there will definitely be someone who can help you there. $\endgroup$
    – L.B.
    Commented Feb 23, 2015 at 2:09
  • $\begingroup$ downvoter! leave a feedback. $\endgroup$
    – Berne
    Commented Mar 7, 2015 at 20:14
  • $\begingroup$ How can an ECG be recorded from the wrist? ECGs pick up the electrical activity from the heart muscle? Where is the wrist signal coming from? $\endgroup$
    – AliceD
    Commented Sep 24, 2015 at 23:30

1 Answer 1

2
$\begingroup$

If you're looking for an explanation of the parts of the waveform you recorded, here's an annotated version:

Annotated ECG Waveform

I hope that helps you map it back to the "standard" QRS you saw. The AV delay is the time between the depolarization of the atria and the ventricles.

I agree, the T-wave is too intense. I'm not familiar with a 3-lead ECG that connects to the wrists--I'm more familiar with chest ECGs. I'm guessing the large T-wave is an artifact of measuring through the wrists (hopefully it's not indicative of a health condition such as Hyperkalemia). It looks like your resting heart rate is around 52 BPM--that's healthy.

The signal itself comes from the heart muscles. It takes a number of milliseconds for the electrical impulse to travel from the sinoatrial (SA) node to the atrioventricular (AV) node, down the His bundle, and finally to the Purkinje fibers in the ventricles. It takes this long because the movement of charge is caused by ions in the cells physically moving. That change in charge is conducted (via normal electrical conduction, such as you see in a wire) through the tissue and muscle to the electrodes on the wrists--this conduction is effectively instantaneous (in this case, it's electrons "pushing" each other, not ions moving within cells as in the case of the heart's electrical system). ECGpedia has some good background on this.
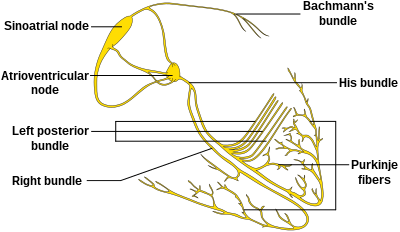
Conduction system of the heart

The ECG system takes the voltage from your right wrist (call this VRA), and subtracts it from the voltage at your left wrist (call this VLA), so that Vlead I = VLA - VRA.
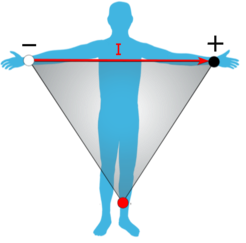
ECG Limb Lead Diagram

So, in summary, the signal you're seeing is produced by the heart's conduction system, not the muscles in your wrists. Muscle noise would manifest itself as noise or random spikes in the ECG.
$\endgroup$
1
  • $\begingroup$ +1, but where on earth does this signal come from you think? $\endgroup$
    – AliceD
    Commented Sep 24, 2015 at 23:32

You must log in to answer this question.

Not the answer you're looking for? Browse other questions tagged .