It seems canadianer's intuition is correct --
Base stacking still occurs in ssDNA, so I suspect that is why you see a temperature dependence
-- based on this paper:
Conformational Changes in Single-Strand DNA as a Function of Temperature by SANS
Motivation --
UV absorption-based measurement of DNA melting temperature is reliant on the assumption that the DNA duplex dissociates into the same single-stranded DNA (ssDNA) random coil conformations at all temperatures. However, calorimetry studies (citations 2 and 3 quoted below) have suggested that temperature-dependent conformational changes occur in ssDNA, too.
Early results from calorimetric studies on the dissociation of a 13-mer DNA duplex have shown, however, that the conformation of the single complementary ssDNA does depend on temperature (2). This was evident in the absolute difference between the heat of dissociation of a 13-mer DNA duplex of 490 kJ mol−1 determined at 74°C determined from differential scanning calorimeter (DSC) measurements and the heat of association of the duplex of −236 kJ mol−1 directly determined at 25°C from batch calorimetry measurements (2). This difference was attributed to the additional thermodynamic contributions from conformational changes in the complementary single strands implied from UV absorption changes upon heating solutions of each of the complementary strands from 25°C to 74°C.
...
More recent results also show a large disparity between the free energies of the dissociation of 10-mer duplexes extrapolated from DSC measurements at high temperature to 25°C and the free energies determined directly from isothermal titration calorimetry measurements on the binding of the single strands of the duplex at this temperature (3). This was again attributed to free energy contributions of the change in the single-strand random coil conformations as the temperature increased from 25°C to the melting temperature of the duplex (3).
Methods --
The authors used a 2 μM solution of 10-mer ssDNA (5′-ATGCTGATGC-3′) in 10 mM sodium phosphate buffer, pH 7.0, containing 0.1 M sodium chloride and 0.1 mM ethylenediaminetetraacetate. Temperature-dependent changes to this solution were measured by three methods:
- Small-angle neutron scattering (SANS) at 10°C increments from 25°C to 80°C. Normalized scattering data were used to compute the geometry of the ssDNA using the LORES algorithm (PDF).
- Optical density measurements (260 nm) between 20°C and 90°C, with a heating rate of 1 K per minute and measurements taken every 30 seconds.
- Differential scanning calorimetry with continuous measurements from 5°C to 105°C at 1°C per minute.
Findings and Conclusion --
Taken together, the SANS and calorimetry data suggest that the change in shape of the ssDNA with increasing temperature is due to unstacking of bases, corresponding to an endothermic transition.
... [the ssDNA] undergoes an expansion in the diameter direction that causes a slightly shortened length as the temperature increases from 25°C to 43°C. Then, as the temperature increases further from 43°C to 53°C, it expands in the length direction as the diameter decreases. Finally, the ssDNA increases dramatically both in length and diameter as the temperature is further increased from 53°C to 80°C.
...
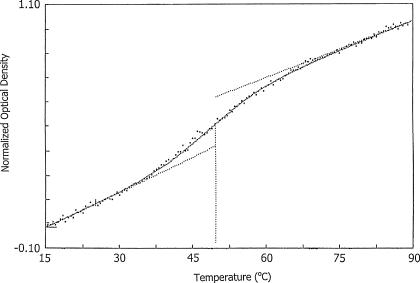
These conformational changes correspond to the unstacking of the A and G purines as well as the T and C pyrimidines in 5′-ATGCTGATGC-3′ as the temperature is increased. The unstacking is manifested in molecular motion of the nucleotides in and out of the cylindrical axis (an increase in diameter) and in the stretching of the helix or cylinder (increase in pitch). The increase in the optical density upon melting of the single-strand substantiates the SANS results since the optical density changes indicate exposure of the purine and pyrimidine bases to a more polar (water) environment.
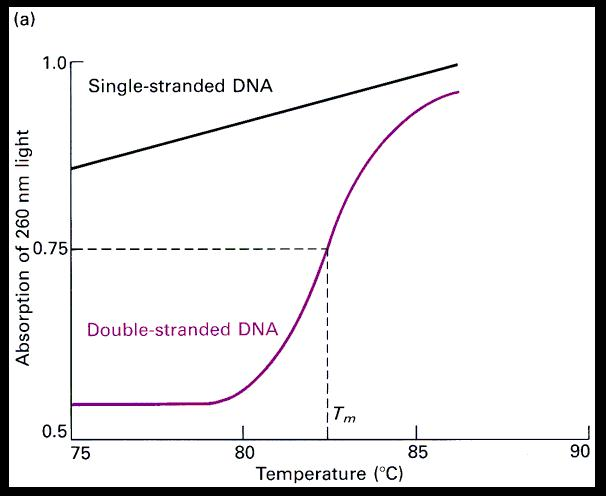
And, as with liliae's figure, the results of the ultraviolet absorbance scan show density increasing with increasing temperature.

Figure 6. Normalized UVM scan of a 2-μM ssDNA solution. The solid line is the least-squares fit of a two-state, A↔B transition model to the data points. The broken horizontal lines are the extrapolated pre- and post-transitional base lines and the broken vertical line indicates the temperature at the midpoint of the transition.


