I am making a program for simulating natural selection. Now, I have discovered an interesting difference between positive selection and negative selection.
Positive selection occurs when the population size is limited by resources. Take bird territories as an example. Assume that there are not enough suitable territories for all the birds of a generation. The fates of the individual birds are interdependent in the following way: Every time a bird finds a territory and successfully defends it, the chances for the remaining birds are reduced. In other words, the chances for each bird of finding a territory depends on how successful other conspecifics have already been.
Now assume that there are two different phenotypes with different fitnesses. A rare mutant has higher chances of finding and defending a territory than the wild type.
The probability distribution of the mutant after selection is described by the little-known Wallenius' noncentral hypergeometric distribution (see Wikipedia: https://en.wikipedia.org/wiki/Wallenius'_noncentral_hypergeometric_distribution )
Now consider negative selection. This occurs when the population size is limited by predation. Assume that the birds are hunted by predators and that the predators have a limited appetite or limited time and energy for hunting, so that the number of surviving birds is fixed. The fates of the individual birds are also interdependent under negative selection: Every time one bird is caught by a predator, the chances for the remaining birds are increased. Assume that the mutant birds have a higher chance of escaping predators. The Wallenius distribution now models the number of birds killed rather than the number of birds surviving. The distribution of surviving birds under negative selection can be called the complementary Wallenius distribution.
The difference between positive and negative selection only applies when the fates of the birds are interdependent. Under positive selection, the birds are selected for survival, one by one. Under negative selection, the birds are selected for elimination, one by one.
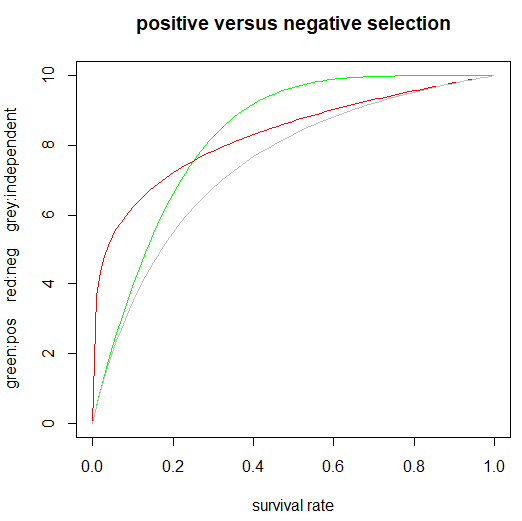
I have simulated these distributions and discovered that positive selection has the strongest effect when the overall survival rate is high, while negative selection has the strongest effect when the overall survival rate is low.
The difference is shown in the following graph. The graph shows the expected number of surviving mutants after positive versus negative selection. The initial population has 10 mutants and 990 non-mutants. The fitness ratio is 5.
The green line indicates positive selection and the red line indicates negative selection. The grey line indicates the situation where the fates of the individuals are independent. We can observe that both positive and negative selection have stronger effects than when fates are independent.
Independent fates means that the chance of survival of each individual is independent of what happens to the other individuals. Independent selection can happen in the following cases: (1) Unrestrained growth. (2) Feeding, when food is plentiful, but difficult to find. (3) Predation, when predators have unlimited appetite, but limited success in hunting the species in question. (4) Diseases: The ability of one animal to survive a disease has no negative effect on the other animals.
The total number of survivors is not fixed under independent selection, but determined post factum.
The difference between the effects of positive and negative selection can be explained most easily by the number of individual selection events. A selection event under positive selection is a bird finding or winning a territory. The number of such events is higher when the survival rate is high. A selection event under negative selection is a bird being caught by a predator. The number of such events is higher when the death rate is high and the survival rate is low.
Now, here comes my question: I find it hard to believe that I could be the first one to discover the statistical difference between positive and negative selection, but I cannot find any literature describing such a difference. Can you please direct me to any literature describing the difference between positive and negative selection in terms of the mathematical/statistical effects.

