6
$\begingroup$

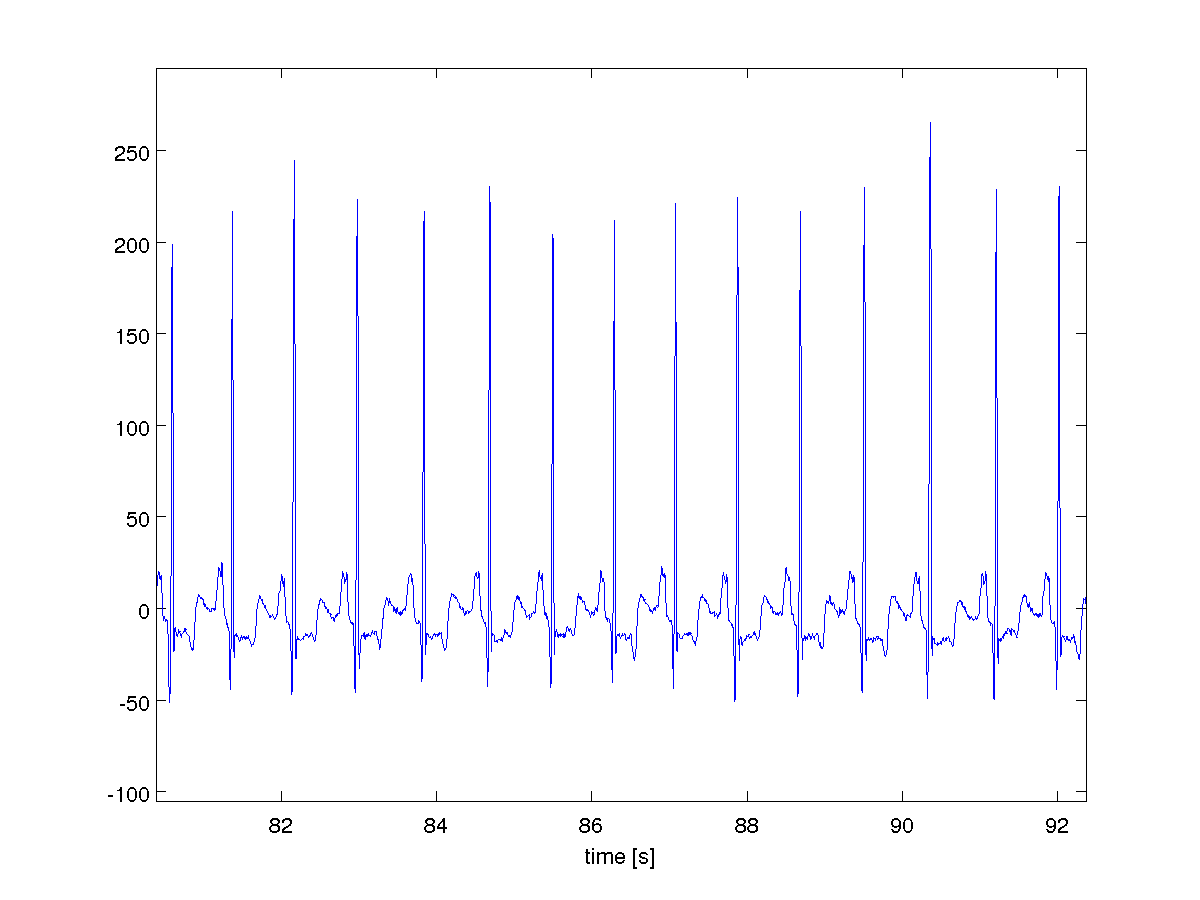
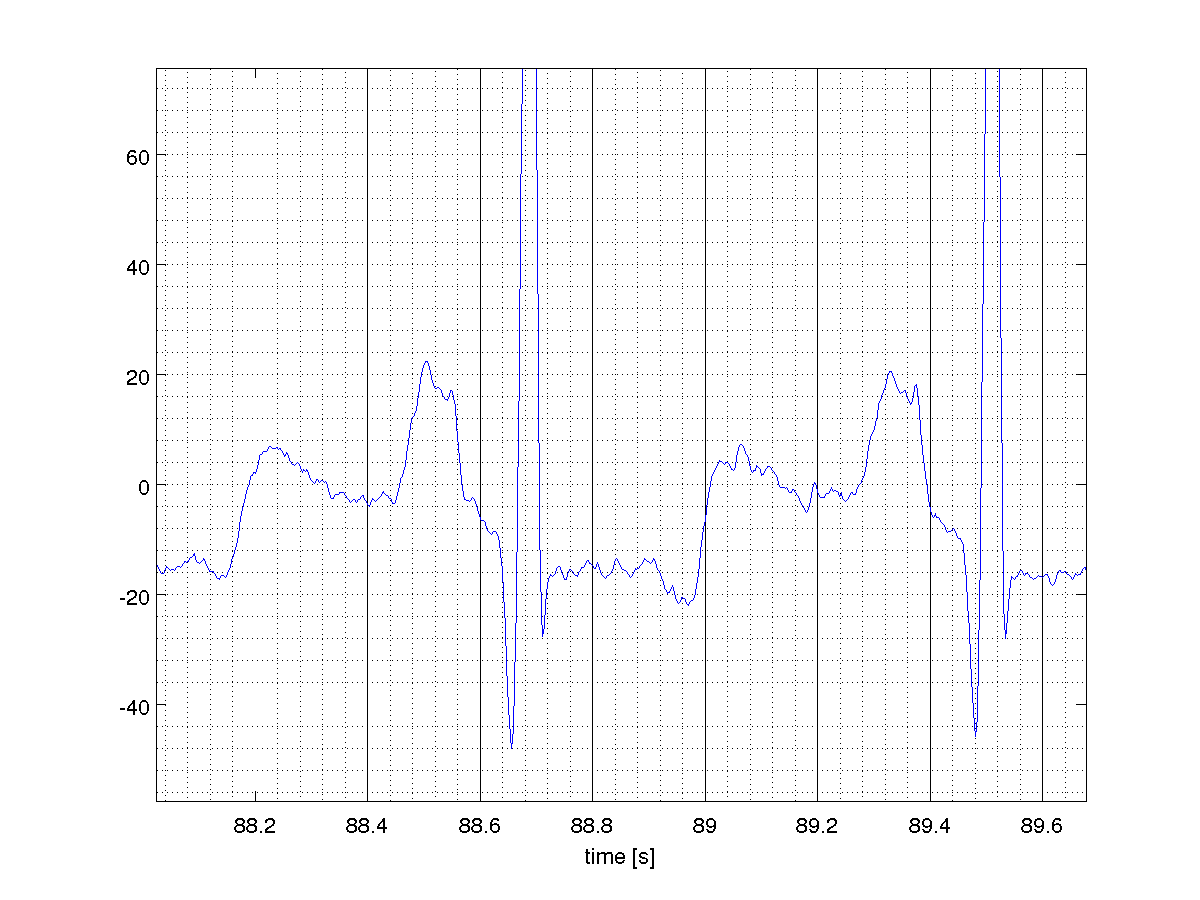
Here are excerpts from an unknown ECG lead. I find it weird that the "baseline" changes after the T wave and doesn't return until after the following QRS complex. Is that normal/expected for any lead?

sec 82-92

zoom sec 88-90

Click for better resolution. I've got another 10 minutes of the ECG, if that would be helpful.

$\endgroup$
6
  • $\begingroup$ Also, I should note that I'm quite inexperienced when it comes to cardiology, so this is probably a basic question -- so don't upvote me too much :) $\endgroup$
    – Andrey
    Commented Dec 21, 2011 at 22:26
  • $\begingroup$ What frequencies are the high pass and low pass filters set at? $\endgroup$
    – jonsca
    Commented Dec 22, 2011 at 1:58
  • $\begingroup$ @jonsca: I've applied a 5-point moving average. As there was no baseline drift I don't think I had applied any other filters, so that would be from the data acquisition tool. It was sampled at 360 Hz. Here are the non-averaged graphs for these intervals: 80-92 sec, 88-90 sec $\endgroup$
    – Andrey
    Commented Dec 22, 2011 at 8:48
  • $\begingroup$ @jonsca: Ok, looks like I had highpassed it at 0.5 Hz. $\endgroup$
    – Andrey
    Commented Dec 22, 2011 at 8:49
  • $\begingroup$ It looks like some kind of line noise or artifact on the unfiltered plot. See if your software has a notch filter for 50/60Hz (depending on Europe or the States). Put that on, then try your moving average, but remember a "boxcar" filter is always going to distort your plot a bit. I'm not an expert on ECG, but I would hedge my bets on this being non-physiological. $\endgroup$
    – jonsca
    Commented Dec 22, 2011 at 12:32

1 Answer 1

5
$\begingroup$

I am not sure if I understand your question correct. What I can see here is a clear ST depression, that might be indicative of myocardial ischemia/infarction. The underlying mechanism is the shortage of oxygen in myocytes leading to elevation of resting potential and slowing of the depolarization -- this accounts for the elevated baseline after T.

I am not at all an ECG expert, but I have seen the misplaces T-P segment many times while at medical school. It wasn't indicative for diagnosis, whereas all other segments were.

So, why are you worrying about this segment?

$\endgroup$
6
  • $\begingroup$ Thanks! Then I know that the TP elevation is fine. About the ST depression, is it clear because there's a large vertical distance between the isoelectrical line (measured at P onset) and right after S, or also because of the horizontal ST segment? $\endgroup$
    – Andrey
    Commented Dec 23, 2011 at 18:51
  • $\begingroup$ Actually an MI often has ST elevation and strong negative QRS complexes $\endgroup$
    – Caters
    Commented Feb 1, 2015 at 5:18
  • $\begingroup$ This is inexact. Both ST elevation or depression can happen. Please be careful when commenting/answering on subjects pertaining to acute health problems. @Andrey ST segment depression in humans is defined by a 1mm (0.1 mV) depression from the isoelectric line. $\endgroup$
    – Raoul
    Commented Apr 29, 2015 at 12:27
  • $\begingroup$ @Raoul The answer is in no way medical consultation, especially for an acute medical problem, as stated in the site rules. The question asked is different from your answer. $\endgroup$ Commented Apr 30, 2015 at 16:26
  • $\begingroup$ @Alexander I did not mean to be rude. Yes,this answer is not about a medical problem. What I meant is that we should be careful with sensitive topics on the website. Bad things sometimes happen to people reading about health on the net, and we should strive to be as exact as we can.I also make mistakes. $\endgroup$
    – Raoul
    Commented Apr 30, 2015 at 16:34

You must log in to answer this question.

Not the answer you're looking for? Browse other questions tagged .