3
$\begingroup$

It has been shown that the X chromosome is frequently enriched for female biased genes, and has a deficit of male biased genes. For example in this paper, and this one.

However, I'm struggling to find papers which test the general distribution sex-biased genes. I am trying to find out if the X is enriched for sex biased genes, e.g. if the X hosts 20% of all protein coding genes, it would be enriched if it carried 30% of all sex-biased genes.

Are there any such studies?


I think I found an answer tucked in the methods section at the back of the Allen paper where 15% of sex-biased genes were X-linked, I'd suggest this means that 15.55% ($100 \times (\frac{1075}{1075 + 4938 + 4323})$) of sex-biased genes are X-linked - other examples are still sought:

"Genes associated with chromosomes 2 (4,323 genes, 37%), 3 (4,938 genes, 43%), and X (1,705 genes, 15%) were used in the analysis; these chromosomes accounted for 10,967 (95%) of the genes... a further 547 (4.7%) of the genes ... were omitted"

$\endgroup$

1 Answer 1

2
$\begingroup$

You can answer this question for yourself using the modMine data warehouse for modENCODE datasets. All you need is a list of female-specific genes (using your identifier of choice, although FlyBase FBGxxxxxxxx are the simplest). You can use their list tools to upload your own list of identifiers, and then there are a bunch of widgets that will tell you things like GO Term enrichment, PubMed references, and one is a histogram plot showing the chromosomal distribution of your genes, and a second histogram showing the "expected" distribution. Access to many modENCODE sites can be found at www.modencode.org

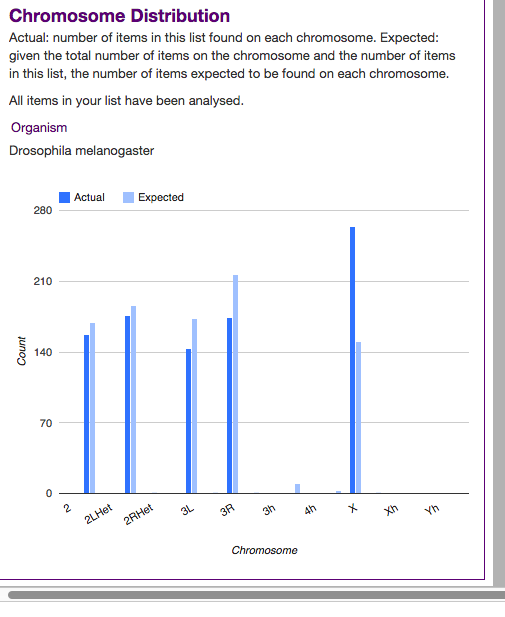
Okay, I went and did this myself. modMine was quite slow, but fortunately the intermine server at FlyMine is working fine. I downloaded Supplemental table 25 from Graveley et al., Nature, 2011 and cut and pasted all of the "Female Biased" IDs for those rows that had FlyBase Gene Identifiers. This figure shows the chromosomal distribution of the 928 genes:

enter image description here

The Labels on the X-axis do not line up properly (for some reason), so here is a table with the Chromosome names and the counts:

Chrom Actual Expected

2L: 157 169

2R: 176 186

3L: 143 173

3R: 174 217

4: 0 10

X: 264 150

$\endgroup$

You must log in to answer this question.

Not the answer you're looking for? Browse other questions tagged .