2
$\begingroup$

I have searched in the web for a detailed explanation of doing such validation experiment, but unfortunately couldn't find a satisfactory one. I came across the following sources:

  • Thermo Scientific Tech tip #58: IMAHO, well written description, but still there are some issues

    Pros

    • Clear on describing terms and straight forward calculations
    • Troubleshooting of the results is outlined

    Cons

    • Not designed to be performed in one 96-well plate ELISA
    • No mention of any acceptable criteria for the both validation tests
    • No mention of blank
  • Quansys Biosciences: a practical design to implement

    Pros

    • Both spike-and-recovery and linearity-of-dilution experiments can be performed in one 96-well plate ELISA
    • Justified introduction of the endogenous sample, which is diluted the same amount as the spiked sample
    • Addition of blank
    • Mention of acceptance criteria for both types of experiments

    Cons

    • No mention of troubleshooting
    • a little bit messy plate design
  • R&D spike and recovery protocol: a brief one but useful

    Pros

    • Clear on design
    • Mention of acceptable criteria at least for the spike recovery 80-120%
    • Mention of blank
    • Hint about possibility of using diluted neat sample until it gives reading

    Cons

    • One sample was used for assessment and not averaging on 3 samples at least
    • No mention for any criteria for linearity of dilution

Issues/Questions
- Q1: How can we combine the two experiments into one plate to spare samples, and materials?
- Q2: Can we dilute sample with assay diluent instead of sample diluent?
- Q3: In case low sample material is there, can we skip the neat sample and add 1:2 diluted one instead to spare material?
- Q4: In preparing spikes in Thermo Scientific tech#58, why was it 10µl spike stock solution added to 50µl sample? what governs this addition, is there any ratio to stick to here or arbitrary ratio? Can we add 90µl sample and 10µl stock solution?

Please feel free to expand sources, or questions, and of course answers are more than welcome to achieve the following aim:

The best design for both validation tests (i.e., spike-and-recovery and linearity-of-dilution) in one 96-well plate ELISA that will use the minimum amount of sample material as possible with explanation of calculations based on averages and clear troubleshooting plan

PS: I am short of reputation to add important tags to enhance searching, e.g.: ELISA, validation

$\endgroup$
4
  • $\begingroup$ This is quite a few questions. I understand why you asked them all together, but if there is not much of a response, you might consider asking separate questions. $\endgroup$
    – blep
    Commented Apr 11, 2013 at 21:19
  • 1
    $\begingroup$ Welcome to the site @doctorate. I agree with dd3 above; there are many questions here, so it's possibly difficult for one answer to address them all. It seems like your last request is actually is the question: "What is the best design for spike-and-recovery and linearity-of-dilution test in one 96-well plate ELISA...". I'd suggest leading with that, and then provide the results of your own research. It gets to the point more quickly, and those with knowledge can read on. $\endgroup$
    – kmm
    Commented Apr 11, 2013 at 22:10
  • 1
    $\begingroup$ @dd3, my concern is that when these questions will be separated and answered individually, the answers can easily be misleading, out of context, and not taking advantage of the different approaches being aggregated into one place, it is a stack exchange after all. $\endgroup$
    – doctorate
    Commented Apr 12, 2013 at 7:21
  • $\begingroup$ Understood. The new title makes the question much clearer. $\endgroup$
    – blep
    Commented Apr 12, 2013 at 15:29

1 Answer 1

1
$\begingroup$

Background:

  • There are a lot of recipes to extract protein from human tissues out there, but all of them boil down to one thing; preserving the tissue proteins as much as possible while obtaining a reasonable yield for downstream applications, using extraction buffer, extra techniques, and by adding protease inhibitors
  • ELISA is one of the those downstream applications that you might be interested in, but one important question? is the sample matrix that you have already obtained valid for the ELISA assay? keep in mind, your sample is not serum, it is a mixture of tissue, extraction buffer, and protease inhibitors, and other things as well
  • Two known assays are usually performed to address the above question. These are, spike-and-recovery (SAR), and linearity-of-dilution (LOD), and these two assays are specific to the analyte that you want to measure in your samples, e.g., cytokines, factors, Igs, etc...and specific also to the tissue, and assay kit as well
  • Often times, you are interested in performing these two assays with minimum resources as much as possible, i.e., less time, less kit materials, and, most importantly, less sample material. This can be quite challenging and it depends on many issues that is out scope of this post to discuss them all
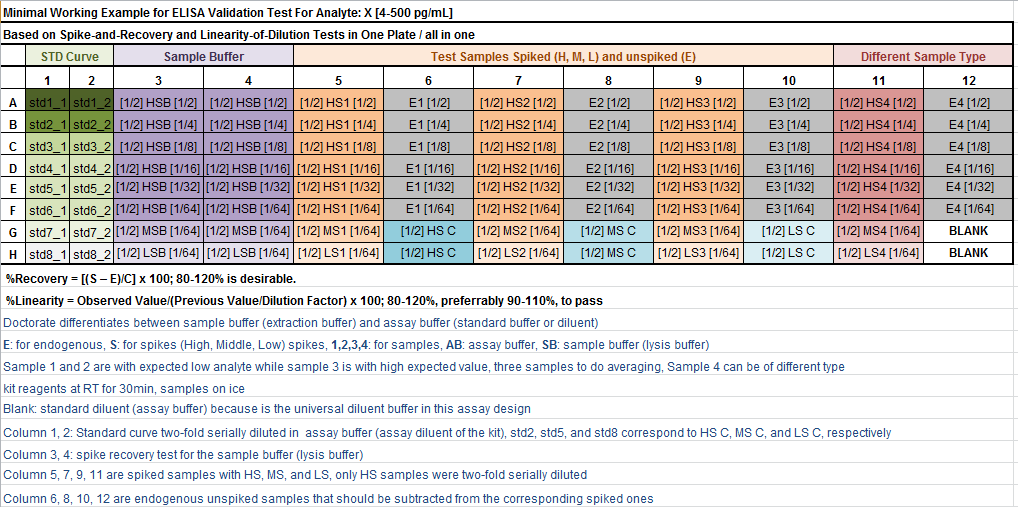
  • If you are interested in performing these two assays using only one 96-well ELISA plate and examine validity of different sample matrices, sample buffer (lysis buffer or sometimes called extraction buffer) for a certain analyte, say X, then this scheme below is for you:

enter image description here

Technical Notes:

  • In this scheme, recovery is examined in 3 types of solutions; assay buffer, sample buffer and samples. These are different in their complexity. Typically, the assay buffer is usually optimized to detect the standard protein provided with the commercial kit
  • The idea of spike-and-recovery is that you add a certain amount from standard stock solution into the wells containing the solution to be tested (e.g., sample buffer or samples) and measure them, to see whether you can recover that amount again, and how much you can recover from it in %. If, for any reason, you couldn't recover that amount in comparison with a control well, where that same amount was added into assay buffer, then this means that something in the test solution is not in favor of the assay. The specific amount you add into the wells is called spike, and it should be the same amount across all tested wells (try to be consistent). Make sure that the added amount when diluted in the well, its final concentration should still be measured by the assay and lie inside your standard curve. E.g., if your standard curve is from 4- 4500 pg/mL, and each well has 100µl of sample, if you want now to add spike into that sample well, you may add whatever amount you want that will still give you at the end a reading inside the standard curve, you may choose to add 10µl from the highest stock which is 500pg/mL, so you end up here with 1/10, that is 50pg/mL, which is fine as it lies inside the 4-500pg/mL range. Alternatively, you can add 50µl sample + 50µl spike (500pg/mL) and would end up with 1/2 dilution (which is the same in this scheme), that is 250pg/mL, which is also fine. So it is up to you to choose, keeping in mind the final concentration should lie inside your standard curve
  • For the linearity-of-dilution, it is obvious that you need a high concentration solution that you can make two-fold (or whatever fold you like) serial dilution from and its reading should still lie inside the standard curve. The best candidate for this is the high spiked wells. The LOD would tell you about the effect of different dilutions on the precision of the assay
  • For SAR and LOD you will get at the end an average percentage from 3 samples at least (calculation example will be provided later), I added a fourth sample, but this fourth can be a different sample type, say samples from tissue culture, so it is up to you to re-design this scheme and be innovative
  • Choosing the best dilution is not an easy task, it is not without compromises sometimes. For example, if you have a harsh sample buffer, you may not have good recovery at 1/2, 1/4, 1/8 dilutions of the sample buffer in assay buffer, whereas almost good recovery is achieved at 1/16, then this dilution factor is most probably the one you should go for in your assay. On the other hand, 1/16 might not be detected by your ELISA assay, which is limited by its sensitivity. Here, the E wells can give you a clue whether you detect something in these unspiked samples or not, that's why I recommend you include at least one sample of high expected value of the analyte in question (this is not easy sometimes to predict) in this scheme, here this is sample 3. One more thing, if you get good recovery at 1/16 DO NOT go to 1/32 or 1/64, as it is obvious that with these higher dilutions you are reducing the chance of the analyte's detectability as it is limited by your assay's sensitivity
  • In most of the cases, you will see that the dilution factor of good recovery of the sample buffer in columns 3 and 4, will coincide with that of the spiked samples in columns 5, 7, and 9. This will give you the assurance that you are in the right direction. If sample 4 is extracted by a different sample buffer, then it is clear that should not expect to end up with the same dilution factor (please, be more reasonable!)
$\endgroup$

You must log in to answer this question.

Not the answer you're looking for? Browse other questions tagged .