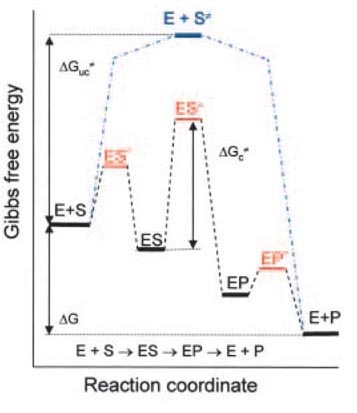
The diagram presented in the question is only one of many variations found in text books and the like. It is unsatisfactory to the extent that it shows one of the intermediates (ES) in the catalysis, but not the other (EP), and that it does not label the species present at each stage. Such energy diagrams are considered in a paper by Aledo et al. in Biochemical and Molecular Biology Education, from which I reproduce their favoured example, below.
Explanation: A simple first order reaction in which a single substrate (S) is converted to a product (P) is shown with intermediates, ES and EP. The transition states between the various conversions in the sub-reactions are shown in red, and that for the uncatalysed reaction (E + S≠) in dark blue. (I am not sure why the E is included in this, except to allow use of a unified diagram.) ΔGUC≠ and ΔGC≠ are the free energy changes in the uncatalysed and enzyme-catalysed reactions, respectively.
This diagram reflects the key point made by the authors of the paper:
For an enzyme-catalyzed reaction, it should be stressed that, under conditions where the overall reaction is spontaneous, each elementary step must exhibit a negative free energy change, and this must be properly reflected in the progression profile of the reaction.
So, to answer the poster’s specific question, for the reaction to proceed not only must the overall free energy change from E+S → E+P be negative, but that of the intermediate stage, E+S → ES must also be negative, i.e. the free energy of ES is lower than that of S — or E+S, to be precise.
(And the free energy of E+P must be less than that of EP, the violation of which principle is apparently a common failing of many diagrams.)

