I'll amend this answer as I get details from you.
What is your cytometer, and how are the optics set up? You typically have 1-5 lasers: UV (355nm), violet (405nm), blue (488nm), green/yellow (~561nm) and red (~633nm) lasers. Your FL number, FL1-4, typically refer to a particular PMT (photomultiplier tube) and filter combination. For example, a typical FACSCantoII has a 4-2-2 setup with 4 PMT on the blue laser, 2 on the violet laser and 2 on the red laser (if you bought the device that way, there are other configurations). These fluorescence channels are set up to detect a particular fluorophore or equivalent with a bandpass filter. The base filters on FACSCanto II red laser are 660/20 and 780/60. These filter light emitted by the stained cells at a particular range of wavelengths, and you read them as 600nm +/- 10nm and 780nm +/- 30nm, for example.
You can set your software up to be FL numbers or fluorophores, but what you need to know is what filter is FL1 and so forth? Typical cytometers like FACSAria, these are FL1 = FITC, FL2 = PE, FL3 = 7AAD, PerCP/Cy5.5, etc., FL4 = APC.
So you used a live/dead thermofisher kit, please provide us also the catalog numbers.
What we want to do is take the information about your dyes and about your cytometer and reconcile them to determine what channel they should fluoresce in. 488nm looks like FITC or FL1 and 570nm looks like PE or FL2, but these look like lasers, whereas you want to tell me the dye emission to match it to a channel, using the information about your device configuration!
As for software, there are a number of good, expensive options like FCS Express and FlowJo but they're costly. See if your core or what have you has these available for you to use on-site. Otherwise, the on-board cytometer software like FACSDiva may need to suffice, and often does. I've used some of the "free" ones but they're very clunky and/or terrible to use.
R has some usefulness for high-dimensional analysis, but you need to be able to use R fluently, and you can't draw manual gates. There do exist helpful packages with good documentation like X-cyt (broad institute), though. And for visualization like PCA and t-SNE, R has a lot of documentation for flow data. Also consider R loads everything into RAM so on a slower 2-4GB computer it might have lackluster performance.
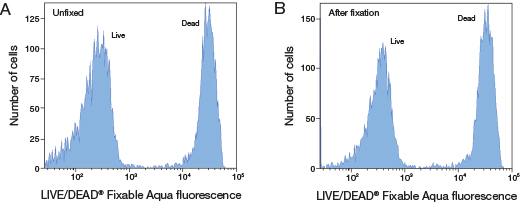
To start with your analysis, I'll ask why did you use two dyes? The LIVE/DEAD product line are reactive with free amines which present inside and outside the cell. Dying cells have more permeable membranes and take up more dye. So when you analyze the cells, everything is positive, but the dead and dying cells are 1-2 logs higher intensity of staining compared to the live population.

So the first thing any flow experiment needs are controls. You have unstained controls, FMO controls and compensation controls. The unstained just gives you an idea your morphology by light scatter, but for low-dimensional experiements can act as an FMO. The FMO or fluorescence minus-one is a cell stained with everything in your antibody/dye panel except one marker, so that you can compare against the fully-stained sample and see where to draw your gate. Compensation controls help the cytometer correct for the fact that filters pick up emission from other fluorophores than the target. You also have a biological control, which is good, because for analysis you always want to see where a clear positive and negative population lay on your dotplots or histograms. Live cells help you see where the positive and negatives are but may have a weak positive signals, and unstained cells will have a negative population that is shifted down 1/2 log or so because they dont have any dye at all. The dead stained cells will show you a strong positive signal and potentially a weak negative signal. Use these to draw your gates.
So then compensate the data electronically with your software (follow the manual), and create a dotplot with FSC-A and SSC-A on the axes. Only experience will tell how your cells look on this plot, but for reference, a blood or leukocyte sample would like like this:

You want to draw a gate around your monocytes and then create a plot based on your monocyte gate (at least gate out debris). It's also useful for further experiments to stain with a monocyte marker so you can dump everything but your target cells, so use CD14, for example, which is specific to monocytes.
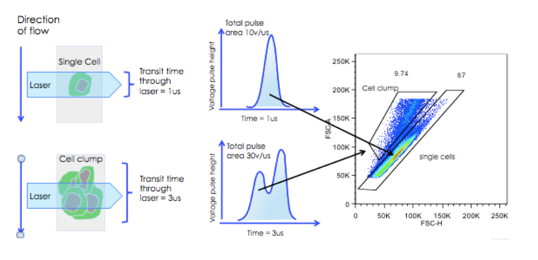
On the next dotplot, make the axes FSC-A and FSC-H. This is a doublet discimination step where laser area scaling done before a cytometer run helps a lot (see your core expert). The principle here is to gate out (get rid of) cells that are stuck together:

Then you would want to look for your target cells. If they're both live/dead dyes you're going to have the same signal on two different channels, so you can probably just pick one, like live/dead green.
You can do a histogram of FL1 based on the cells kept in the doublet plot. You should see two discrete peaks on a log or bi-exponential transformed intensity axis (width basis -10 is good to use, but FACSDiva does it automatically). Width basis is a co-factor that compresses the data around 0, so negative populations get smaller and you get better resolution among the positive populations.
You would draw a bifur gate between the positive and negative peak or a range gate around the positive, and select tell the software to generate statistics to get your percentages. And you can repeat for the FL2/red dye to get those percentages, too, but both markers are looking at the same thing.
Then, apply those gates to all your samples and adjust the gates based on what the data looks like.
Please try this presentation: https://www.slideshare.net/richardhastings589/kumc-introduction-to-flow-cytometry


