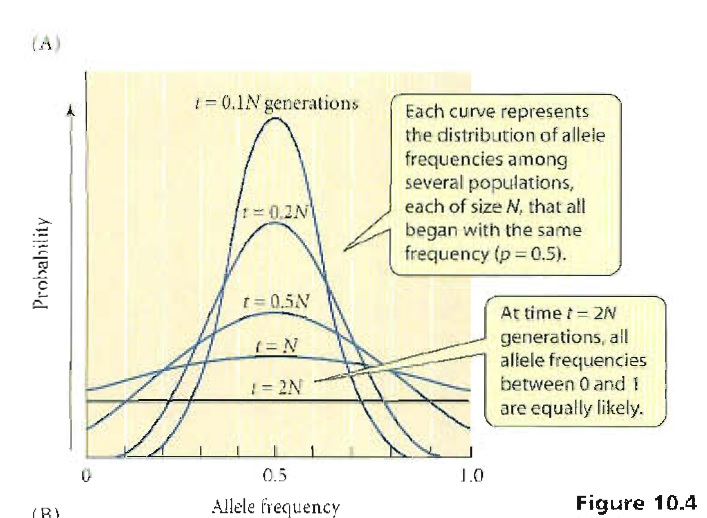
I am studying evolutionary biology, and been presented with this graph:

I am having some difficulties understand its meaning. For a start, why is time measured as a fraction of the population size? Also, what does it mean by allele frequency? Does it mean the frequency of a single allele? But if the first caption it referred to 'frequencies'... Any help? :)
