1
$\begingroup$

I'm trying to understand how isotopes can tell me something about the charge of the different peaks. This pdf file mentioned the following about isotopes in correlation with the charge of the peaks:

Isotopes
If the mass spectrometer you are working with has sufficient resolution look at the isotopes, a singly charged ion will show isotopic peaks that differ by 1 mass unit, a doubly charged ion will show peaks that differ by 0.5 mass units and so on. This is another way to deduce the charge state of a peak and thus the mass.

So let's suppose the spectrometer has a sufficient resolution to look at the different isotopes. It's not really clear for me at which peak I have to start. So to summarize my questions realted to this topic:

  • Which peak do I have to look at when determining the charge based on the isotope distribution?
  • Why would the peaks differ 0.5 mass units (see above)?


update
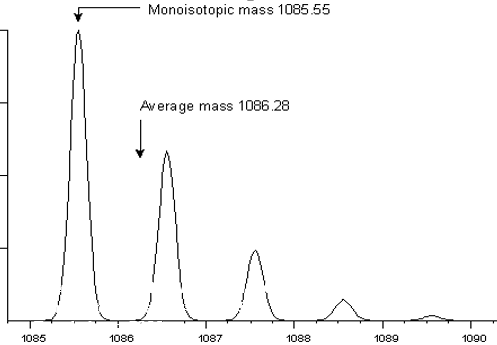
source: http://mascot.proteomix.org/help/mass_accuracy_help.html
When looking at the above graph, there is a difference of 1 amu between the different peaks.

  • What do the isotopes have to do with the charge?
  • What does this charge (and isotope distribution) tells us about the peak on which we zoomed in to create the above graph?
$\endgroup$
5
  • $\begingroup$ It's not clear whether your second quote is talking about mass, charge, time of flight (which is not measured in all MS systems, only TOF ones), or a ratio of two of those parameters. Also, is this single or tandem MS? $\endgroup$
    – MattDMo
    Commented Sep 30, 2016 at 12:05
  • $\begingroup$ The source says it's about ESI @MattDMo, I'm not really into this subject so I can't clearify it that much... $\endgroup$
    – KingBoomie
    Commented Sep 30, 2016 at 12:11
  • $\begingroup$ I happen to work with a bunch of people using nanospray LC-MS/MS for protein sequencing and analysis of post-translational modifications, so I'll forward this question on to them and see what they think. $\endgroup$
    – MattDMo
    Commented Sep 30, 2016 at 12:19
  • $\begingroup$ Would be great! @MattDMo $\endgroup$
    – KingBoomie
    Commented Sep 30, 2016 at 12:33
  • $\begingroup$ @RickBeeloo; the first article is referring directly to TOF analysers in your quote. It is irrelevant to your question and should be removed. $\endgroup$
    – Michael_A
    Commented Sep 30, 2016 at 21:45

2 Answers 2

3
$\begingroup$

If you have an ion of mass 100 and charge 2, the m/z ratio (let's exclude the root) will be 100/2=50. If you have isotopes, then you expect to find several peaks for a given fragment. For example, the masses of different isotopes of the same molecule could be like: 100, 102, 105 and 107. In this case the spectrometer will detect four peaks, instead of one, for the same molecule (will look something like this): 100/2, 102/2, 105/2 and 107/2. The charge of all that peaks is the same.. it's only the mass that differs.

The page you linked simply makes an example, "singly charged ion will show isotopic peaks that differ by 1" example m=10 z=1 m/z =10, for the isotope m=11 z=1 m/z=11 (difference of 1). If you have a doubly charged ion m=10 z=2 m/z=5 and for the isotope will be 11/2=5.5 (difference of 0.5).

So, if you take the spectra of a compound and you see the isotopic peaks having a distance of 0.5 among each other, you are looking at a doubly charged ion, if the distance is 1, it's a singly charged ion.

What do the isotopes have to do with the charge? Given that the isotopes peaks are around 1 units far from each other, you can conclude that the ion you are looking at has 1 charge.

The last question is not clear to me.

$\endgroup$
5
  • $\begingroup$ That's exactly what I thought until I read the givin citation that isotopes can be used to determine the charge of ions in the spectrum @alec_djinn $\endgroup$
    – KingBoomie
    Commented Sep 30, 2016 at 12:36
  • $\begingroup$ Do you have a spectrum example of this to clarify what you are suggesting? alec_djinn $\endgroup$
    – KingBoomie
    Commented Sep 30, 2016 at 12:58
  • $\begingroup$ Here you see the spectra of a molecule having 2 positive charges, the zoom-in picture on the right shows how the peaks of that specific compound are 0.5 units distant from each other. $\endgroup$
    – alec_djinn
    Commented Sep 30, 2016 at 13:11
  • 1
    $\begingroup$ If the ion has only one charge, m/z=m , since there are no "half masses", the isotopes can differ only by full units of mass (+1, +2, +3 ...). To explain a difference of 0.5 units in an m/z chart, z must be 2! It's not the mass that is 0.5. $\endgroup$
    – alec_djinn
    Commented Sep 30, 2016 at 13:16
  • 1
    $\begingroup$ Thankyou for your effort! Can you please answer the questions beneath my update. If I get those two questions clear I think I'm done and can mark your answer. (answer them in your answer please) @alec_djinn $\endgroup$
    – KingBoomie
    Commented Sep 30, 2016 at 13:57
3
$\begingroup$

I've changed the order of your questions so that the answers follow from one another.

What do the isotopes have to do with the charge?

The presence of isotopes has no effect on the charge of the molecule. The physiochemical properties of the molecule and how the MS has been setup dictate how molecules acquire charges.

This is important as methods which utilise isotopic labelling rely on the presence of isotopes in molecules having no effect on their physiochemical properties. Secondarily, life would become untenable if the incorporation of isotopes altered the properties of proteins (see below).

Which peak do I have to look at when determining the charge based on the isotope distribution?

The m/z of the isotope peaks provides information about charge so you use the spacing between isotope peaks. It is important to use the most accurate measurements, which will be the strongest peaks, to calculate the mass difference. There is no need to use the monoisotopic (M) peak which in some cases will not be present.

~ 1.1% of the carbon on the planet is C13 so on average in biological molecules 1.1 out of every 100 carbons will be the C13 isotope. Therefore, as biological molecules get larger C13 will be incorporated more frequently and the chances of measuring the monoisotopic peak reduces.

What does this charge (and isotope distribution) tells us about the peak on which we zoomed in to create the above graph?

enter image description here

Lets assume the m/z difference between the monoisotopic peak (M) and the isotope peak with 1 isotope per molecule (M+1) is; 1086.55 - 1085.55 = 1

We know that the mass for the isotope is ~1 so z must equal 1 when the isotope peaks have a difference of 1 m/z.

Why would the peaks differ 0.5 mass units(see above)?

Let's assume we're working with the same molecule as above (M = 1084.543) but it is doubly charged. In this instance it will have an m/z = 543.778 and the first isotope peak (M+1) will be measured at 544.278 m/z.

We know that m = 1 when a single isotope is present so the difference of 0.5 m/z => 1/0.5 = 2. The charge (z) is 2.

Note that every charge adds a proton at 1.007276 mass units to the monoisotopic mass of the charged molecule. However, when we talk about the monoisotopic mass of the molecule we don't want to include protons. That is why M = 1084.543 rather than the 1085.55 m/z (and mass) of the singly-charged molecule that was shown in the image above.

$\endgroup$
4
  • $\begingroup$ Thankyou great explanation! I still have a question, let's assume I need to anlyse a spectrum by hand. I first have to look at the charges of the ions (thus peaks) to determine the molecular mass right? but how can I determine the charge of a peak? I know I can look at the spec and see if there are peaks with half the mass so I know they are doubly charged, but are there other methods? @Michal_A $\endgroup$
    – KingBoomie
    Commented Oct 1, 2016 at 8:03
  • $\begingroup$ No worries. The question(s) about MS/MS should probably go in a new question. The details depend on how the fragments were produced and the detector that was used. Mascot provides good details about fragmentation. $\endgroup$
    – Michael_A
    Commented Oct 1, 2016 at 8:23
  • $\begingroup$ Thankyou I appriciate your help! I posted a question which is related to spectra analysis biology.stackexchange.com/questions/52034/… maybe you are interested answering this one @Michael_A. Feel free to edit this question because as I said earlier I'm not really into this topic but really want to understand it. $\endgroup$
    – KingBoomie
    Commented Oct 1, 2016 at 8:53
  • $\begingroup$ OK, I've edited your question to exclude references to calculating "t" as it was based on a misunderstanding of the original paper. I think the question is clearer/better without it. $\endgroup$
    – Michael_A
    Commented Oct 1, 2016 at 9:15

You must log in to answer this question.

Not the answer you're looking for? Browse other questions tagged .