14
$\begingroup$

I am conducting an investigation into the effect of two different grass management techniques (grazing vs. machine-mowing) upon floral biodiversity.

I have collected my data and now need to process it in a way that will yield meaningful and valid results. My data is in the form of 25 samples per area with %-abundance measured for each species in a 0.25m2 quadrat.

I am currently using a non-standard diversity quantification technique, called Disney's index (which I have been led to believe is named eponymously after R.H.L Disney, however I am unable to find any references describing this), in which we assign each species a weight based on percentage abundance, as follows:
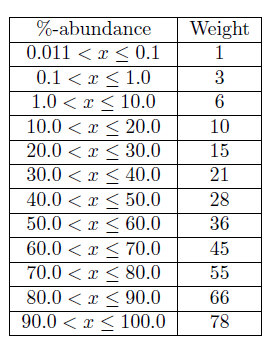
                                           Table showing weights for %-abundances

We then use these weights to calculate the index as follows (i.e. by computing the sum of the weights of the species, over the number of species):

                                                                    enter image description here

I want to know if this is the best possible diversity index I could use for this type of analysis, or whether there are others which I should be considering.

Thanks in advance!

$\endgroup$

4 Answers 4

5
$\begingroup$

It sounds like you are interested in beta diversity which is the change in taxa composition (i.e., alpha diversity) between plots. There are a number of approaches to calculating beta diversity and the correct choice generally depends on the question(s) you are trying to answer. The most common approaches are very well described in this paper:

Anderson, M. J. et al. 2011. Navigating the multiple meanings of Beta diversity: a roadmap for the practicing ecologist. Ecology Letters 14:19-28

P.S. I am not familiar with Disney's index so I cannot comment on its merits.

P.P.S. You may also be interested in this question.

$\endgroup$
3
$\begingroup$

I don't know anything about the "Disney index" but the equation you use looks like it's a version of Simpson's D, a very common biodiversity index. If you're just estimating two different kinds of sites (your two management strategies) I would suggest a rarefaction method. This can be estimated in either the vegan package in R, or EstimateS http://viceroy.eeb.uconn.edu/EstimateS/ by Robert Colwell. Rarefaction takes into account the number of samples you have when calculating an estimate of the number of species you find. You could also use straight forward species richness estimators like Chao1 and Chao2. The best "diversity index" in my opinion is Hurlbert's PIE

Hope this helps.

$\endgroup$
3
$\begingroup$

You might want to look at Koleff's paper (open access @ JAE http://onlinelibrary.wiley.com/doi/10.1046/j.1365-2656.2003.00710.x/abstract).

Given that you have quantitative data, you should look at the difference between presence/absence and quantitative measures. A Bry-Curtis measure or something to that effect would be way better than a Sorensen or Whittaker here, lest you lose information.

$\endgroup$
0
$\begingroup$

All the other answers are totally valid, and I agree with them. In your case I would not use Disney's index since you have reliable proportion for abundance and Disney's conventionally assign a number. I think this step might hide some of the information in the data. In your case I would use a quantitative similarity coefficient.
You can find a lot more on similarity coefficient in this book Numerical Ecology along with other useful analysis like clustering.

$\endgroup$

You must log in to answer this question.

Not the answer you're looking for? Browse other questions tagged .