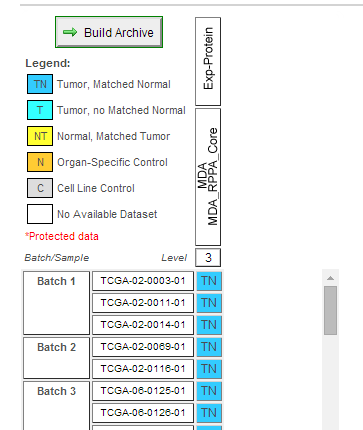
The TCGA Project has been collecting primary tumors and matched normals per patient per cancer indication and has been exome (WXS) profiling those samples, and genome (WGS) profiling a subset of them. In those cases, the primary tumor is tissue collected from the primary tumor and the matched normal is usually a blood samples, but could be derived from a buccal swab or some other source. As you can imagine, it would make less sense in terms of expression to assay matched control that derives from another tissue type such as blood.
For the expression data, the majority of the data comes from RNA-Seq and array-based profiling of the primary tumor data, and in some cases where adjacent normal tissue was collected and submitted, the TCGA has also profiled those samples. These are probably what you are seeing with your TN filter, and generally why you are having trouble finding equivalent amounts of matched normals as compared to primary tumor samples for the expression projects.
Incidentally, the company I work for has recently launched a free genomics data portal for the research community called GeenPool Reference. As part of it, we have deposited all of the publicly available TCGA RNA-Seq. The data along with all the associated clinical metadata is readily available for navigating and data mining. You'll easily be able to figure out the quantity of samples, and their matched pairs. If you're interested, you can take a look at the data projects available in GenePool Reference here: http://www.stationxinc.com/reference-library
~Sandeep

