0
$\begingroup$

In his answer to another question, Bryan Krause says:

Ion channels don't exhibit any firing patterns: neurons exhibit firing patterns that depend on all the channels present [...].

I understand it this way: The observable and measureable firing pattern1 of the neuron (created at the trigger zone) is the linear superposition of tiny "firing patterns2" of all the (voltage-gated) ion channels at the trigger zone, which in turn depend on the probabilities of opening and closing which are the same for all ion channels of the same type and obey some Hodgkin–Huxley-like law. These probabilities correspond directly to the shape of firing pattern1.

The rhythm with which each single sodium channel opens and closes ("firing pattern2") doesn't have to mimick firing pattern1 exactly, only roughly and probabilistically: the open-close-ticks must occur near to the spikes of firing pattern1, but not exactly and not at every spike. And some complete outliers are allowed. The rest is superposition.

Seeing things this way, indiviudual ion channels do exhibit "firing patterns2", but these may look quite different than firing pattern1 (although not completely).

Is this kind of reasoning correct?

If so: Can the following conclusion be drawn: The time scale of a firing pattern1 depends on the number of ion channels at the trigger zone? This might be seen when looking at the rise time of a single action potential: If there is only one sodium channel, rise time will be larger, if there are many, it will be smaller. Is this correlation strictly linear?

$\endgroup$

2 Answers 2

2
$\begingroup$

Typically the activities of the ion channels are not called firing patterns as in neuroscience we refer to "firing" when we mean the elicitation of action potentials (spikes) but yes: Whenever an AP was fired a sufficient amount of sodium channels had to be open and therefore I thing your reasoning is correct. In other terms what you are saying is that the effective channel conductances change during an action potential.

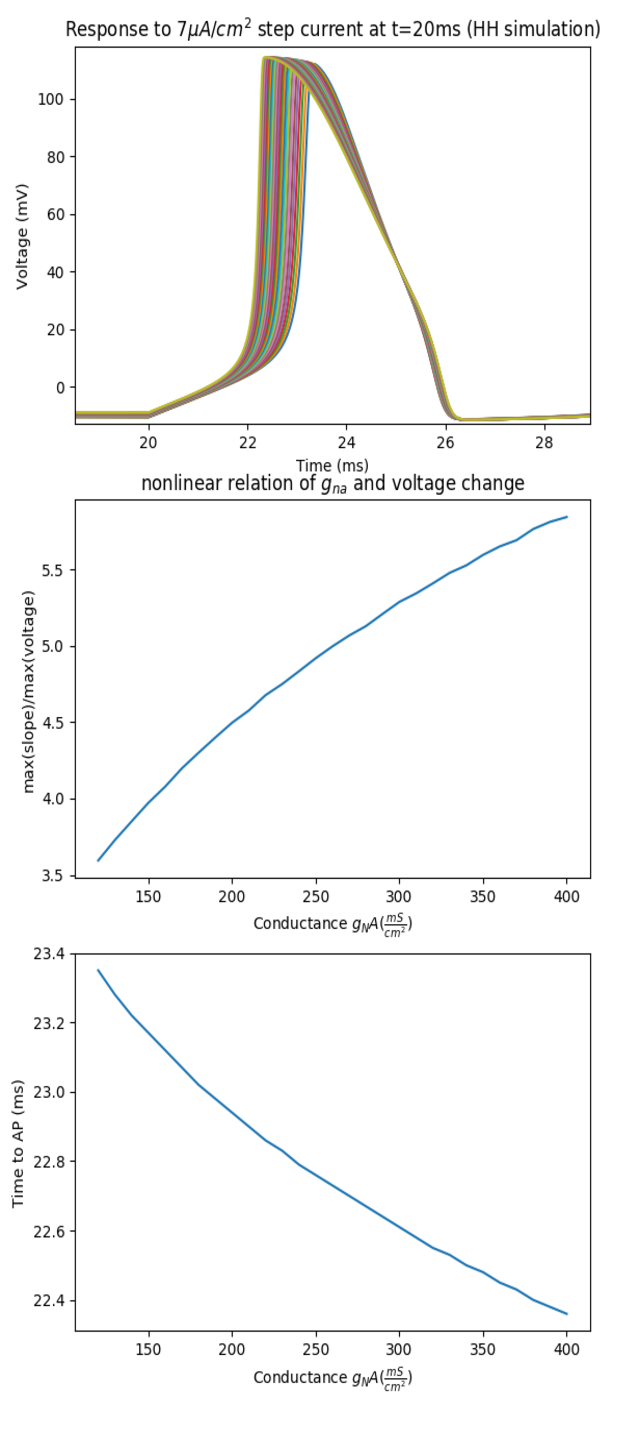
On your conclusion: In the regime of natural parameters the time scale of firing pattern 1 mostly depends on the time constants of the voltage gated ion channels and not so much on the absolute number of channels (especially if all the conductances would scale equally). In the world of Hodgin-Huxley like coupled- and nonlinear-dynamical systems the voltage does not scale strictly linear with increasing the participating max. conductances. The interplay of max. conductance and temporal gating dynamics resulting in the effective conductance itself depends on the voltage and there are nonlinearities. So the correlation between the number of channels and the AP rise time is not expected to be strictly linear.

See the figure for a little example: I tested my reasoning by increasing the max. conductance for the sodium channel of a simple HH model and checked the max. steepness of the voltage (normalized by peak voltage).

Hope that answers your question(s).

Hodgin Huxley Simulations for increasing number of NA channels

$\endgroup$
16
  • $\begingroup$ +1. Simulations are always appreciated! I've formatted your figure to remove the white space on the top but feel free to roll-back to the previous version if you don't like the result. $\endgroup$
    – vkehayas
    Commented Dec 6, 2017 at 20:39
  • $\begingroup$ I like this answer, but I think it's a bit too forgiving of the misconceptions in the original question. The original question seems to presume that firing frequencies in neurons come from the open and closing times of ion channels, which is not accurate, or at least not accurate in the sense of how an ion channel physiologist/biophysicist would use those terms: channels flutter open and closed at much much higher rates. $\endgroup$
    – Bryan Krause
    Commented Dec 6, 2017 at 21:03
  • $\begingroup$ Searching briefly, this page has a good depiction of the difference between single channel openings versus populations of channels: nerve.bsd.uchicago.edu/med98b.htm $\endgroup$
    – Bryan Krause
    Commented Dec 6, 2017 at 21:07
  • $\begingroup$ Thanks for the edit, vkehayas. Yes, I fully agree Bryan! It took me some while to translate the question into a way I am used too discuss such issues. After reformulating my comments in that direction again and again I decided too just remove the paragraph completely and to give more like a minimal and "forgiving" answer but yes, you are right. $\endgroup$
    – Jojo
    Commented Dec 7, 2017 at 12:30
  • 1
    $\begingroup$ You are mixing two different things: One is the probabilistic fluttering between open and closed states of the channels which you can imagine as a binary process (Bernoulli, short time scale) and the other on top is a slowly varying process dependent on the systems state (things like the voltage). The latter shapes the expectation value of the fast process over time. The quote from Wikipedia just states that the expectation value of the fast process goes down within miliseconds (which is slow in comparison). Hope that helps $\endgroup$
    – Jojo
    Commented Dec 10, 2017 at 12:14
0
$\begingroup$

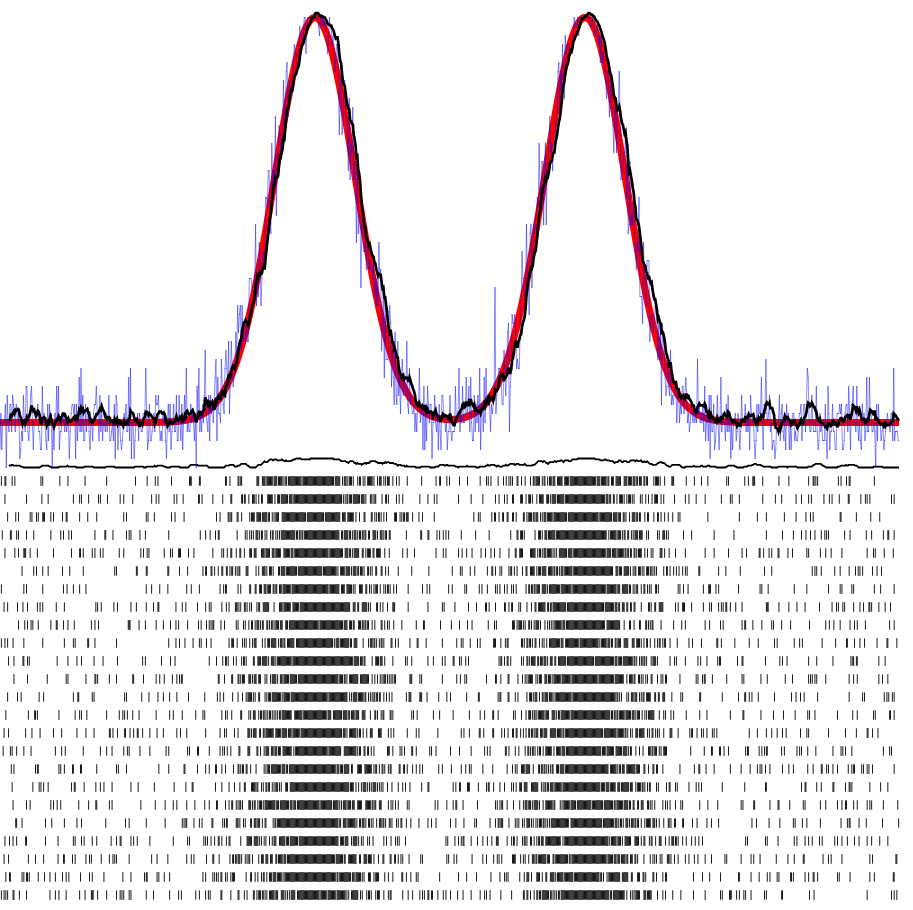
Let me summarize what I believe to have learned from Jojo's and Bryan's comments in form of a visualization: The red curve is the probability governing the open and closed state of an ion channel (as a function of time - we see two spikes) The dotted patterns below show 50 ion channels fluttering between open (black) and closed (white) states, according to the probability of being open. The thin black curve is a smeared out average of the first ion channel being open (showing two slight elevations, i.e. on a coarser time scale some kind of "firing pattern" – please forgive me, Bryan). The fat black curve is the smeared out average of all ion channels. The blue curve is the number of channels being open at a given point in time which is somehow proportional to the conductance, current, and/or voltage being measured. Noise is large due to the small number (25) of ion channels.

enter image description here

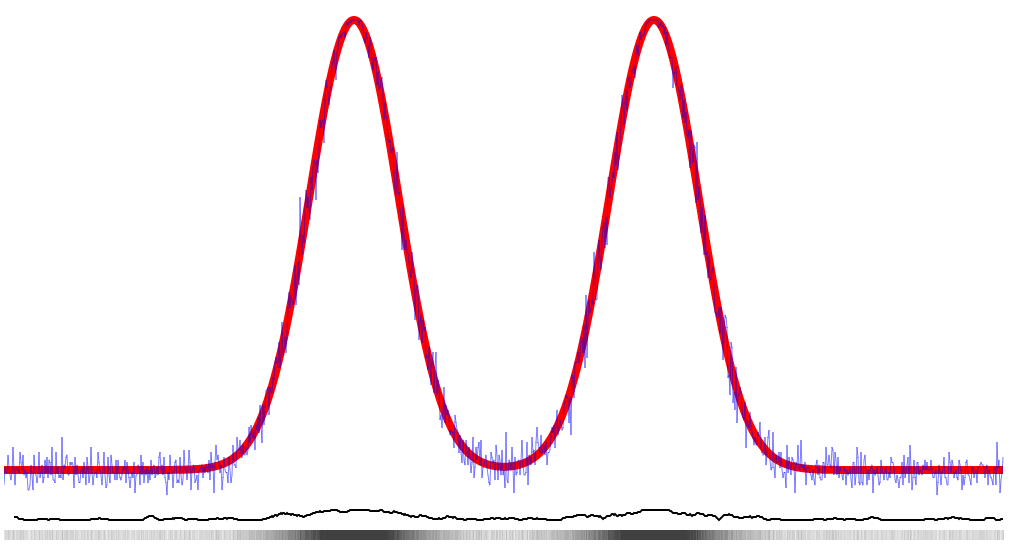
For 200 ion channels and overlaying the 200 patterns, it would look like this:

enter image description here

Find a higher resolution picture here.

See two related biological scenarios here and here.

$\endgroup$

You must log in to answer this question.

Not the answer you're looking for? Browse other questions tagged .