7
$\begingroup$

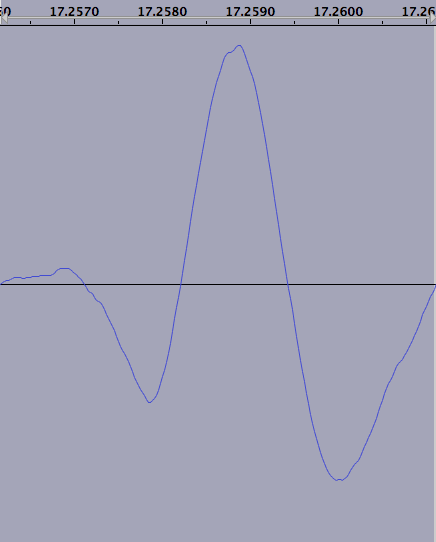
Ok so for a bit of a background, I am doing a science project looking at the action potentials of the earthworm. I anaesthatized the worms then hooked them up to a spiker box (http://backyardbrains.com/products/spikerbox) and stimulated them. This is an average result: Average action potential (they all looked somewhat like this)

What I am confused about is why the action potential goes negative first before then going back up. From my readings online, I thought that the action potentials were meant to go up first then travel down and then continue on its course. If it helps I used a program called audacity to record the action potentials.

Thanks very much guys. Sorry if I'm not being clear. Just ask anything if you need more information!

$\endgroup$

2 Answers 2

4
$\begingroup$

Nice graph. What happens when you reach the top of the potential (when you depolarize the membrane) that you need to go back to a resting potential to be able to stimulized again. The membrane gets "neutralized" and this reaction often over-shoots and goes below the resting potential, which is quite normal. Before reaching the normal resting potential there will be no further activation. The Wikipedia article on the "Action Potential" contains a more complete explanation.

$\endgroup$
7
  • 1
    $\begingroup$ This answers why it hyperpolarizes after reaching the peak but why does it hyperpolarize BEFORE the action potential ? $\endgroup$
    – biogirl
    Commented Dec 20, 2013 at 10:33
  • $\begingroup$ In the graph above? My guess would be that two pulses of activation come directly behind each other. $\endgroup$
    – Chris
    Commented Dec 20, 2013 at 10:44
  • $\begingroup$ Sorry for not responding (christmas stuff). @Chris - could you please expand that a bit more? Oh a bit more information about the earthworm incase this influences how it goes negative first: they have 3 main nerve cords carrying the action potentials, 2 of them carrying the signals down the worm and the other transmitting them to the front. Would this at all influence it? $\endgroup$
    – Jamesg
    Commented Dec 27, 2013 at 10:03
  • $\begingroup$ Do you record the impulse from one isolated nerve or is it possible that you record more than one? $\endgroup$
    – Chris
    Commented Dec 27, 2013 at 10:41
  • $\begingroup$ Hm that is possible. Because the equipment I was using was not specifically "designed" for worms (it was designed for cockroaches) I have no way of knowing. If you go to the website that I have put here it has a photo of the pins which you put into the worm. However, if it is true that the results are being influenced by the other nearby nerves sending their signals, why is it the same for all the action potentials I recorded? I have around 50 photos which are almost identical to the one above (length wise). $\endgroup$
    – Jamesg
    Commented Jan 18, 2014 at 23:53
3
$\begingroup$

Did you ever get an answer to your question? I know this may be too late now, but I was noseying around and spotted it, so I'll take a stab nonetheless. I could be wrong, but I suspect what you're seeing here may be an extracellular representation of an action potential (and/or it could be a filtering artefact, see below). From the video on the spikerbox website, it looks like you place the electrodes (nails?) into the animal and hope to get close to axons and see spiking activity. Correct me if I'm wrong.

From a brief reading of the literature it would appear, under optimal conditions, the waveform of the extracellular action potential (EAP) is dependent on the cell type and location of the electrode along the neuron (this paper illustrates this nicely). As you move away from the soma and down the axon/dendrites, you tend to see this more prominent initial spike, as you see in your recordings. This is due to the ionic conductances and timings of channel openings. So that's one possible explanation...
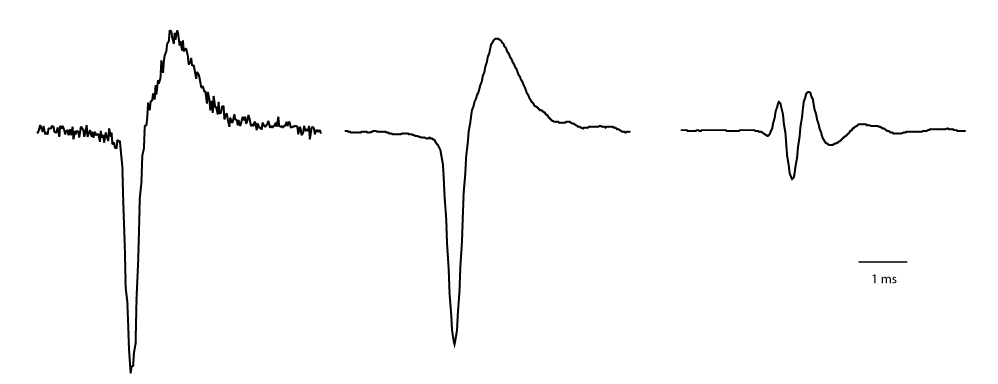
Extracellular spike with filters

Here's the other: the signal is filtered in some way. I notice in your figure your signal is very smooth without any noise and your EAP very long (assuming your x axis is seconds), which suggests to me your acquisition rate is quite low and/or being filtered. I've attached an image of an EAP I acquired (from a cell soma) a while back (with an acquisition rate of 10Khz, i.e. I 'sampled' the signal 10000 times per second to get the trace). They're all the same EAP on the same scale with different types of filters applied. The original signal is the one on the left; note all that baseline noise. The middle one is a low pass filter of 2KHz (gets rid of signals higher than that). The right hand one is a 750 - 1000 Hz band pass filter. This type of filter does funky things to signals if used incorrectly (such as in this example!). It basically only allows signals within a given region and gets rid of signals outside of it. What you end up with is the signal on the right, which looks suspiciously like yours!

So I'd hazard a guess and say it's a problem due to how the system collects and filters data. BUT, there could be a biological basis for it too.

However, there is one thing that does confuse me, and that is the polarity of your waveform. I would normally expect the prominent point of your EAP to be pointing downward. I have two suggestions as to what may be the cause of this:

  1. You're actually measuring currents here; the units for your Y-axis would help answer that one.
  2. Some grounding issue.
$\endgroup$

You must log in to answer this question.

Not the answer you're looking for? Browse other questions tagged .