12
$\begingroup$

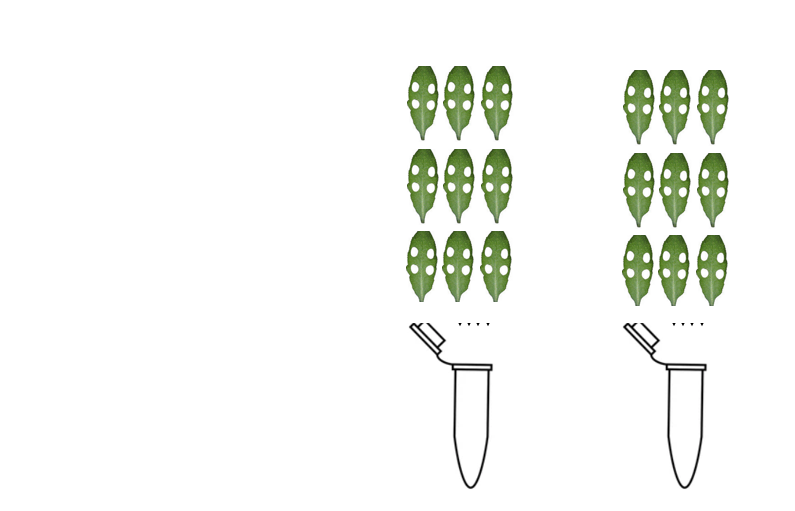
I am measuring specific phenolic compounds in leaves of A. thaliana. I have many different varieties, and different treatments. Initially I was measuring one leaf per plant for three plants for each treatment, cultivar combination (left in example image). Taking leaf punches is the fast part, actually processing the samples is very time consuming and rate limiting. To increase my accuracy and throughput, it would be nice if I could sample more than 3 plants per treatment,variety combination! In this case the standard deviation should represent the differences inbetween samples of the same treatment, cultivar combination.

Therefore, I am now opting to mix the three samples from the three different plants from the same treatment,cultivar combination and repeat this two or three times (right in example image). This way I will lose measurements of single plants, but I should still be measuring the average of my treatment, cultivar combination. By doing measurements this way, it also means I can pool more than 3 plants, for example 6, in a single sample, while keeping the same amount of processing work afterwards. In this case the standard deviation should represent the accuracy of my laboratory practices, but the mean is actually closer to the true mean.

My question is if this is scientifically sound to do?

Example

$\endgroup$
4
  • 1
    $\begingroup$ I’m voting to close this question because it is much more appropriate for CrossValidated $\endgroup$
    – Ben Bolker
    Commented Apr 23, 2022 at 0:18
  • $\begingroup$ Why are you pooling the samples multiple times? Are you planning on doing different analyses on the different samples? $\endgroup$ Commented Apr 23, 2022 at 23:29
  • $\begingroup$ After asking why you don't think circumstances alter cases, I'll go with Ben Bolker. $\endgroup$ Commented Apr 24, 2022 at 1:34
  • $\begingroup$ I am pooling the samples multiple times to get some sort of a standard deviation, as said it should represent the difference between pooled samples and/or accuracy of my assay $\endgroup$
    – Rivered
    Commented Apr 25, 2022 at 6:33

2 Answers 2

18
$\begingroup$

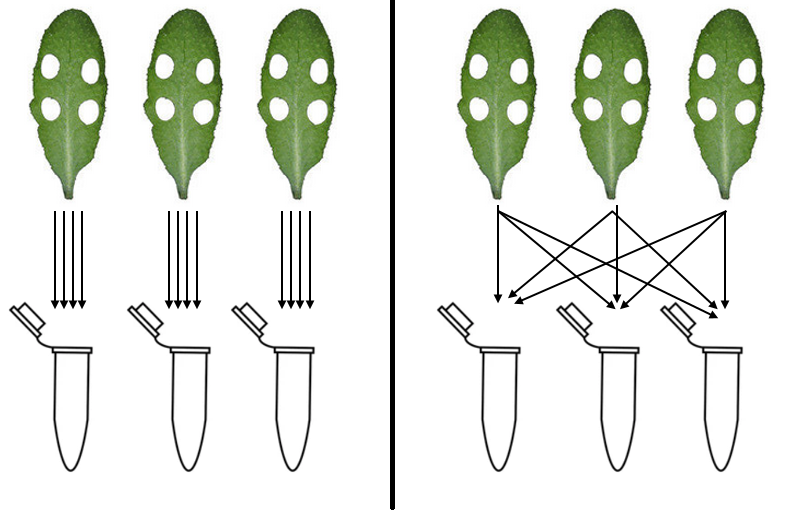
If you use the configuration on the left, your variance across tubes reflects variance between individuals.

If you use the configuration on the right, your variance across tubes reflects primarily variance in your assay (and perhaps variance within a leaf a bit).

Usually, you do an experiment like this because you'd like to be able to extrapolate your results to a larger population. To do that validly, you need to be able to estimate the variance in the population from your sample: the variance between individuals. Your configuration on the right will help you tell whether your samples are internally different, but they don't tell you much about what you can expect outside your sample. Importantly, one outlier plant would contaminate all the samples it contributes to.

Note that unless your effect sizes are expected to be very large, 3 individuals per group is likely an underpowered sample, meaning you do not have enough observations to detect a true difference in your groups. You cannot get around this by taking more samples from the same individuals, you need more individuals.

There are some cases where you might use an approach like on the right to test your assay, though not to draw conclusions about differences in treatments.

The language we use in statistics to describe these scenarios is independence. For, say, an unpaired t-test to be valid, the samples must be independent, both within and between groups (same is true for ANOVA equivalents with multiple groups). In the right scenario, your samples are not independent: every sample that includes part of "leaf 1" is going to have a relationship with every other sample that includes part of "leaf 1". If you treat those samples as if they are independent, you are breaking the assumption of your hypothesis tests and cannot rely on the results when comparing groups.


For a bit of an analogy that moves away from the more complicated biological assay part, let's say you want to know whether Group A is heavier than Group B. The procedure on the left is like weighing each member of Group A, and comparing these weights to members of Group B.

The procedure on the right is like having all members of Group A stand on a scale, then get off, then all stand on a scale again, then get off, etc. You'll have the best measurement you can get of how much the specific sample of Group A weighs across different measurements on your scale, but you won't be able to use your sample of Group A to estimate how much variation there is in Population A: your variation will just tell you how reliable your scale is. This is clearly a very very wrong procedure that is equivalent to the approach as you are proposing on the right-hand side of your question. Do not take this approach, you will waste your time and your results will be incorrect; if you hide the fact that you've taken this approach your work will be fraudulent.

$\endgroup$
6
  • $\begingroup$ Thank you. You state a wrong procedure, but you also say it gives the same result. In my case I can have a much higher and more accurate throughput with the wrong procedure. Therefore, from a non-scientific perspective, this method could be preferred? $\endgroup$
    – Rivered
    Commented Apr 25, 2022 at 6:35
  • $\begingroup$ @Rivered It definitely does not give the same result. Do not use the procedure depicted on the right to compare your groups, you will have wasted all of your time or committed outright fraud if you do. Not sure where you got the idea that it's the same result, but if you can quote from my answer what made you think that I will change it ASAP. $\endgroup$
    – Bryan Krause
    Commented Apr 25, 2022 at 13:07
  • $\begingroup$ I toke the remark from your statement "it's the same design as". In any case I understand your answer, and statistics are useless without estimations of variation. The whole point of my questions was the throughput, with the "wrong" procedure I will be able to measure 10-fold more samples, and although missing variance, the group mean will be much more accurate due to the high sample number. $\endgroup$
    – Rivered
    Commented Apr 25, 2022 at 14:02
  • 2
    $\begingroup$ @Rivered In the analogy section I am describing a procedure that is very wrong, yet is equivalent to the design you propose on the right-hand side of your question. Do not do this procedure. And no, the mean measured the way you propose will not be any more accurate as a population estimate. "Less variance across samples" does not mean your mean is more accurate, it just means you estimated the variance wrong. $\endgroup$
    – Bryan Krause
    Commented Apr 25, 2022 at 14:07
  • $\begingroup$ I am not saying my mean is more accurate because of the lower variance! I say my mean is more accurate due to the ability to measure much more samples in a pooled way. To put it in terms of your analogy, I can place 100 people on a single scale, whereas time constraint wise I could only weight 3 people seperately. The mean of 100 people will be much more close to the true value, compared to the mean of just 3 people? $\endgroup$
    – Rivered
    Commented Apr 25, 2022 at 14:53
1
$\begingroup$

Your intuition is largely correct here. Bryan Krause's comments focus on where your answer is wrong. Some of his statements are true, others are speculative. His answer, combined with your intuition, could improve your measurements. I've shown a pooling scheme below. It should address the key ideas from both your question and Bryan's reply. The two key ideas here are (i) that pooling can improve estimates and (ii) that repeated measurements can give you insight into sampling variation.

Each observation you make will show a different amount of the phenolic compound. Some of this is due to actual differences in the amount of the phenolic compound. These differences can exist between fields of plants, between leaves on a plant, between punches from a single leaf. The list goes on. Furthermore, each measurement of a single sample produces a different reading. This is a lot to account for. If you would like to use statistics, then you should make it clear how your sample relates to the population you are interested in.

You mentioned that taking leaf punches is relatively easy. Pooling leaf samples uses that to your advantage. Let's say you will only be making three measurements for cultivar A and three measurements for cultivar B. For the first measurement you could grow 9 plants of cultivar A, and take 4 punches from each of those plants. You mix these punches together and measure the abundance of your phenolic compound. For the second measurement on cultivar A, you could repeat this entire process using different plants. The difference in these two measurements reflects sampling variation. This is due to all the sources mentioned above, and others. Decreasing the number of plants you pool doesn't solve the problem of sampling variation.

From a statistical standpoint, pooling can allow us to average. Lets say punches $i = 1, 2, \ldots, n$ are taken from cultivar A. They are prepared as equal volume samples. The corresponding concentration of the phenolic compound in each sample is $A_i$. Mixing these solutions results in a sample with concentration $\bar A_n$. The formula for this concentration can be obtained from the concentration of each $A_i$ as follows $$ \bar A_n = \frac{1}{n} \sum_{i = 1}^n A_i $$ These concentrations would be different if we repeated the experiment with a new sample of punches. To capture this, we can treat them as random variables.

We would like to show that pooling decreases the variance of $\bar A_n$. To see when this can happen note $$ \text{Var}\left[\frac{1}{n} \sum_i A_i\right] = \frac{1}{n} \left(\frac{1}{n} \sum_i \text{Var}[A_i]\right) + \frac{2}{n^2} \sum_{i < j} \text{Cov}(A_i, A_j) $$ The leading factor of $\frac{1}{n}$ is a key term here. It has the potential to make the variance small when the number of punches $n$ is large. This highlights the benefit of pooling, and is consistent with your suggestion.

A pooling strategy. Each tube measures a mixture created using multiple punches. Each punches is measured in a single tube. pooling scheme

$\endgroup$
1
  • 1
    $\begingroup$ Thank you, I think I get the core message in your story :). I.e. For a single treatment/genotype combination, I could do three measurements, every measurement containing pooled samples of multiple unique plants! $\endgroup$
    – Rivered
    Commented May 10, 2022 at 8:56

You must log in to answer this question.

Not the answer you're looking for? Browse other questions tagged .