4
$\begingroup$

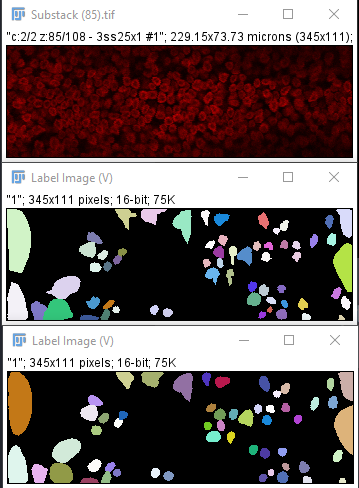
I've got some images such as the one in this post, obtained from the neuroepithelium of a chick embryo in a confocal microscope, where nuclei have been fluorescently labeled. I'd like to be able to segment these nuclei, in particular to see their total area (which means I don't necessarily need them to be separated) and to count them. I tried using StarDist on Fiji, but I've obtained some very bad results, with it detecting basically no nuclei.

Does anyone have any suggestions on what I might do?

Here's a link to the original image in tif format: https://drive.google.com/file/d/1GqsUI-xnTPSKnRv_ECxJL7K785_qbq2c/view?usp=sharing

Below there's a comparison of my original image(above), with the StarDist output with low probability/score threshold and low overlap threshold (middle) and with default settings (below). Previously, default settings would output a completely black image, but it seems to have changed.

enter image description here

$\endgroup$
2
  • $\begingroup$ Welcome to SE Biology. It would be useful to see your best 'bad result' from StarDist and maybe a link to a tiff version of the image. $\endgroup$
    – Michael_A
    Commented Apr 27, 2022 at 7:00
  • $\begingroup$ Thanks, I've edited the post with the extra information $\endgroup$ Commented Apr 27, 2022 at 11:36

2 Answers 2

6
$\begingroup$

The "Analyze Particles" function in FIJI might work.

You will run into a few problems in any entirely automated analysis because your image isn't even brightness across the image; the corners, especially the top and bottom right are substantially dimmer than the rest of the image. You might need to play with the balance of brightness to compensate in any analysis that you do. You could also cut the image into chunks and process each separately, but you might run into the problem of counting bits of the image more than once.

For the Analyze Particles function you need to

  1. Convert your image into binary (Process>Binary>Make Binary)

binary

  1. Watershed (Process>Binary>Watershed); this draws lines across narrow parts of the image, creating a "watershed" (like water running off a ridge between mountains)

water

  1. Analyse particles (Analyze>Analyze Particles) - play with the conditions in the pop-up window. It'll output a table with all the results, a summary page and, if you set it, an overlay window (I've shown ellipses here, but there are a few options).

overlay

I'd recommend working out the minimum size of your nuclei (I got roughly 6 pixels) and using that as the lower bound in the size setting, and working out the circularity of the objects to help get rid of small/inaccurate counts. You should also set the overlays (from the show: drop-down in the analyze particles window) - ellipses might be your most useful and comparable to the ones in your posted analysis. It will help you set the conditions for your final analysis.

I've had a go with your fairly small TIF image and it isn't great (see images above) - partly because of the resolution of the image, which is only 1 micron per pixel. If you have a higher resolution image, it should work better with a high resolution image. I got about 300 particles with min size set to 6, but this includes all the objects shown in the overlay (step 3). You might want to further filter out the smaller results manually before statistical analysis.

$\endgroup$
6
  • 1
    $\begingroup$ +1 Good answer. I've run across this need to automate counting of things (mitochondria and nuclei and synaptic boutons...) before, so often, in so many different labs. Just use FIJI/ImageJ and play around with settings and try to find parameters which are reproducible and sensible to others ( = have someone else tune the parameters independently and see if yours are similar). Surprisingly I have never heard of a better approach than FIJI. You'll have the advantage of using something open-source. Always report the parameters you set, it's good scientific practice. Good luck! $\endgroup$
    – S Pr
    Commented Apr 28, 2022 at 11:21
  • $\begingroup$ Thank you very much!! You approach gives pretty good results at first glance. The problem here seems to be that most nuclei exhibiy a "hole" in the fluorescence, which are kept by the watershed algorithm. That said, I've thought of another (more complex) way of calculating this and will be comparing both methods! I'll be trying to obtain better images of course, but this was a first approach to the problem. Thanks again for your trouble! $\endgroup$ Commented Apr 28, 2022 at 14:10
  • $\begingroup$ @SantiagoBosch I noticed the holes in the nuclei and tried the Process>Binary>Fill Holes option, but it just combines all the nuclei that overlap in the middle of the image, and it doesn't work after watershed. You could try really increasing the brightness + contrast of the red image (Image>Adjust>Brightness+Contrast), then process to binary, but I don't know if that will work either. $\endgroup$
    – bob1
    Commented Apr 28, 2022 at 20:51
  • $\begingroup$ @SPr I guess because IJ/FIJI have been designed for scientists by scientists working on the same problems as us, and it is free + open source, it makes it an ideal tool, and someone will have come across your application or something similar in the past and worked out a solution. You can also automate most of the processing using IJ fairly simply (as you can in photoshop etc) if you care to learn a little bit of programming in Macro or Java. $\endgroup$
    – bob1
    Commented Apr 28, 2022 at 20:56
  • $\begingroup$ Fiji have a machine learning segmentation utility (WEKA). it's simple to train and use. $\endgroup$
    – heracho
    Commented Jan 19 at 17:57
0
$\begingroup$

I'd really urge you to look into machine learning for this task. You can probably get away with classical image analysis for an 80/20 solution on a particular image set, but it will be a lot of work getting there and it probably won't generalize very well.

In particular, I've had good success even for difficult cases (eg where nuclei touch or where only a subset of nuclei were to be counted) with U-Net based segmentation: In such cases, to count nuclei, I've trained U-Nets not really to segment but to place a dot on each nucleus. Counting dots you get a very good approximation of nucleus count. See here for details.

In order to get area, shape, intensity... as well, it can be useful to train an algorithm to segment an image into three classes: background, object (nucleus), and border. This way, you'll mitigate the problem of touching regions which makes it difficult to tell apart different objects in the segmented image (see here).

Oh, and there are plenty of solutions out there, these days, for training machine learning algorithms without having to know much about how they work.

Full disclosure: I'm one of the developers of one of these solutions, VAIDR.

$\endgroup$

You must log in to answer this question.

Not the answer you're looking for? Browse other questions tagged .