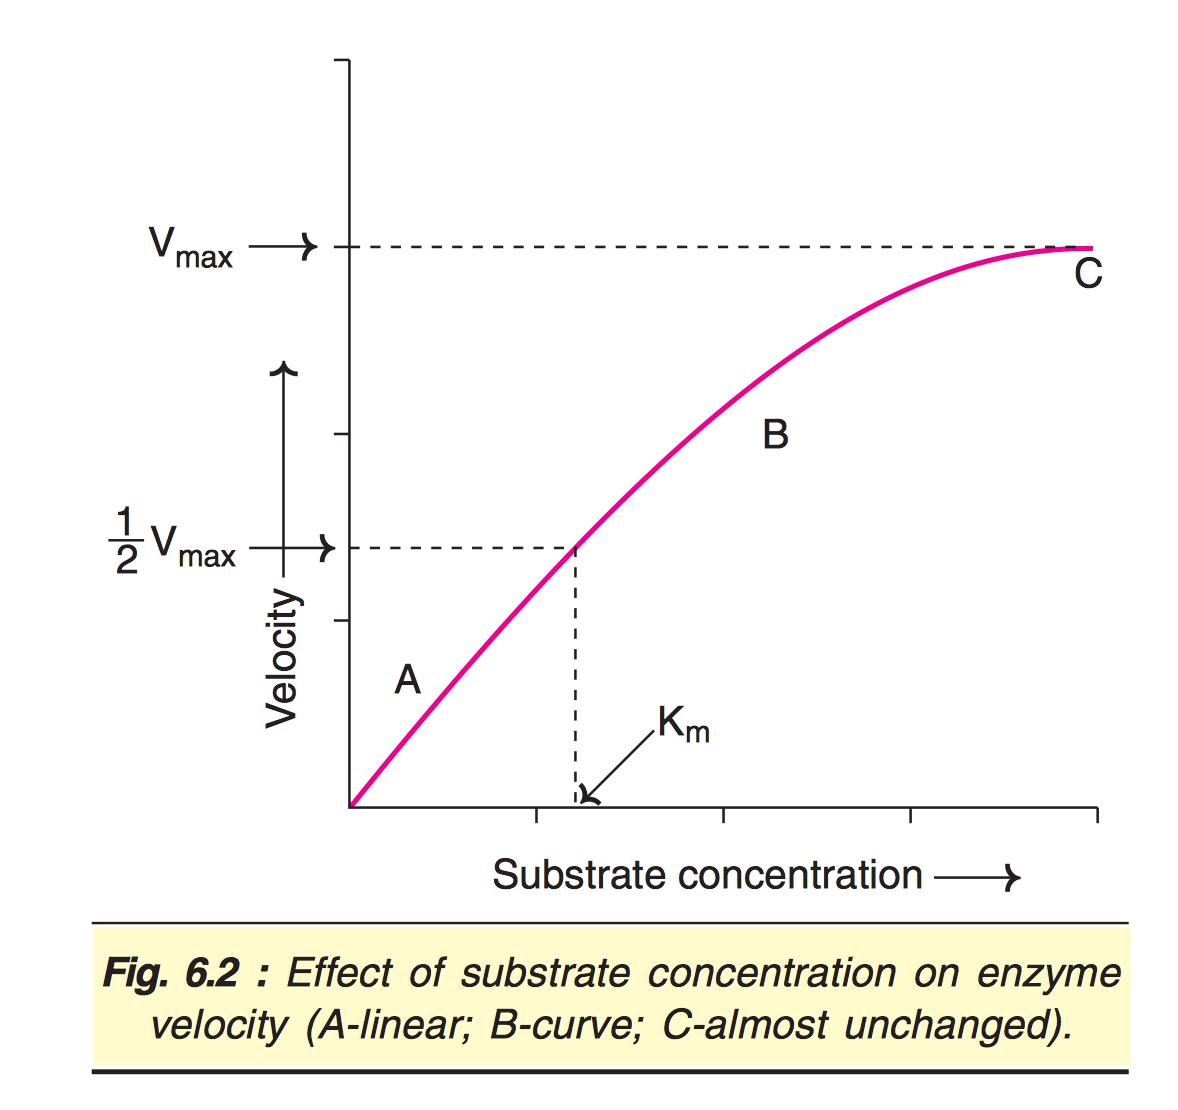
Your image is not correct.
According to Lehninger (2000):
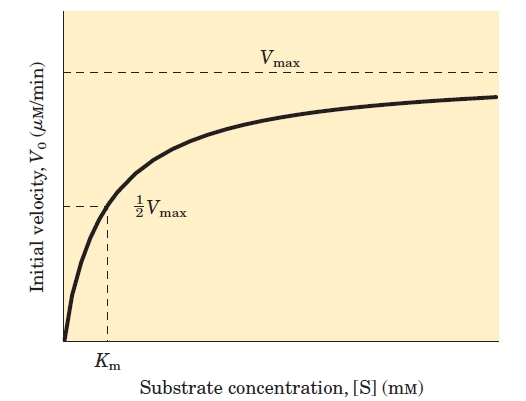
At relatively low concentrations of substrate, V0 increases almost linearly with an increase in [S]. At higher substrate concentrations, V0 increases by smaller and smaller amounts in response to increases in [S]. Finally, a point is reached beyond which increases in V0 are vanishingly small as [S] increases. This plateau-like V0 region is close to the maximum velocity, Vmax. (emphasis mine)
This is the image that comes after that paragraph:

FIGURE 6–11 Effect of substrate concentration on the initial velocity of an enzyme-catalyzed reaction. Vmax is extrapolated from the plot, because V0 approaches but never quite reaches Vmax. The substrate concentration at which V0 is half maximal is Km, the Michaelis constant.
Thus, regarding your questions ("Why don't we achieve enzyme saturation linearly? Why do we go through that curved phase( region B )?"), the answer is: there is no line, it's all curved.
Source:
- Lehninger, A., Nelson, D. and Cox, M. (2000). Principles of biochemistry. New York: Worth Publishers.


