1
$\begingroup$

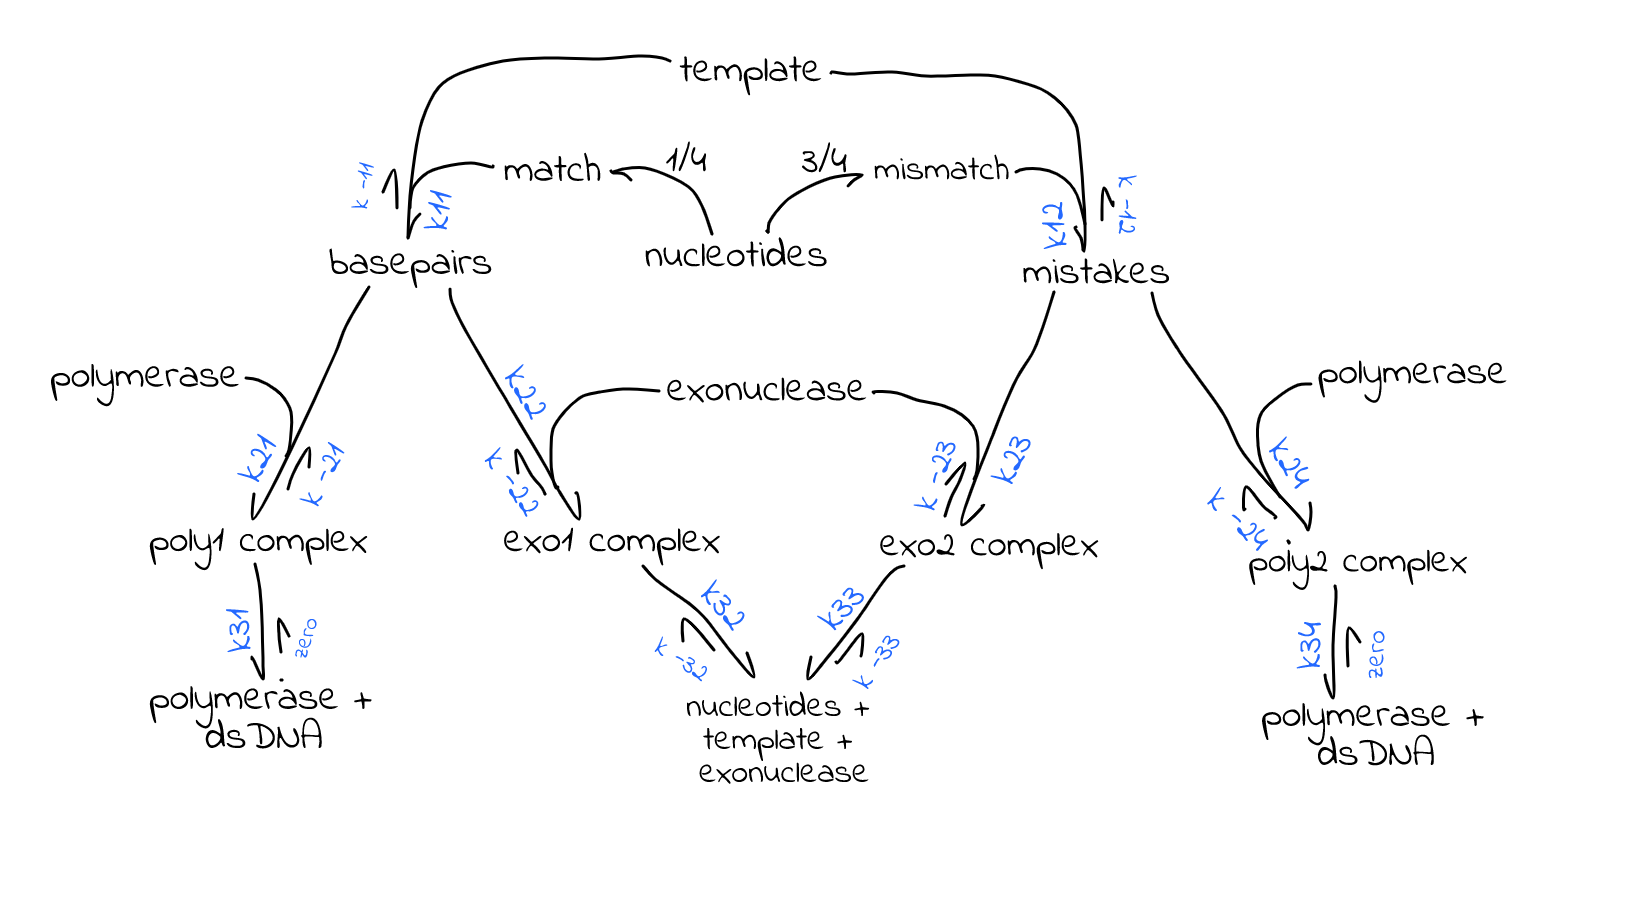
Can the following oversimplified biochemical pathway for DNA synthesis serve as a model for evaluating the degree of the effect that the 3' to 5' exonuclease affinity for mismatched base pairs can have on the degree of the fidelity of dsDNA synthesis? Is this idea basically correct to model the relationship?

enter image description here

Thank you for your attention

$\endgroup$
3
  • 1
    $\begingroup$ What do you think, and where specifically are you stuck? Homework questions are off-topic on Biology unless you have shown your attempt at an answer. For more information see our homework policy. "Homework" is interpreted to mean any academic or other assignment, test preparation, or task given in relation to a class, educational setting, or self-learning. $\endgroup$
    – MattDMo
    Commented Aug 13, 2020 at 15:37
  • $\begingroup$ @MattDMo — It doesn’t sound like homework to me, but neither does it sound like a question in terms of SE Biology. More like someone with a more numeric training starting out in Systems Biology and soliciting comment on his schema. $\endgroup$
    – David
    Commented Aug 13, 2020 at 16:05
  • $\begingroup$ No, it is not a homework. I follow a course on DNA replication and had a lecture on the role of the 3' to 5' endonuclease domain of the DNA Polymerase. It was said that the activity of the endonuclease alone improves the error rate of dsDNA synthesis. I wondered if a biochemical model can demonstrate that or even quantify the effect of the endonuclease. So my question is thinking in terms of a pathway makes sense. I think of implementing a model in MATLAB to see if just by changing the exonuclease's affinity for the mismatches improves the fidelity of the synthesis. I appreciate any comment. $\endgroup$ Commented Aug 13, 2020 at 18:32

1 Answer 1

1
$\begingroup$

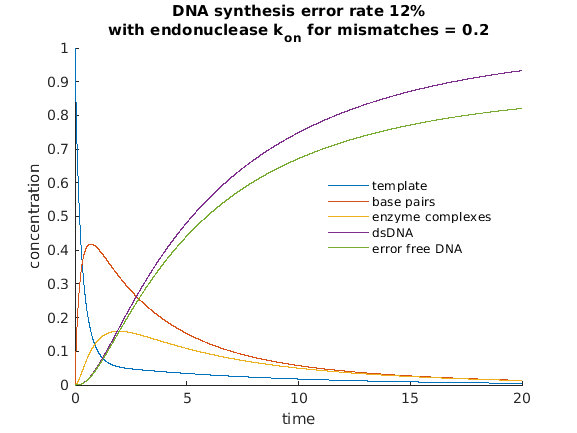
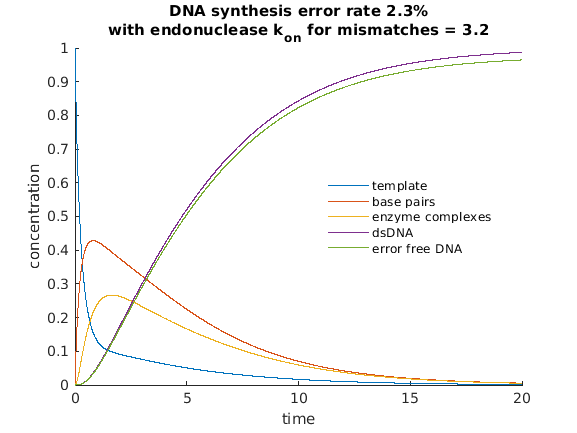
well I tried to implement this pathway in MATLAB and it seems to me that it makes some sense. Here are two versions of the reaction progress simulation, one with low and the other with high affinity of the 3' to 5' exonuclease domain for the mismatches. The violet curve of the simulation corresponds the amount of synthesized dsDNA and the green curve corresponds to the error-free amount of that dsDNA.

The next figure shows that with low affinity of the exonuclease for the mismatches, the error rate is high (12%).
enter image description here

The figure below shows that the dsDNA synthesis error rate decreased with the increase of the affinity of the exonuclease for the mismatches.
enter image description here

The MATLAB code of this simulation is provided

https://matlab.mathworks.com/users/mwa0000016879211/Published/x551/x551.html

Your comments and suggestions are most appreciated.

Thanks,

$\endgroup$

You must log in to answer this question.

Not the answer you're looking for? Browse other questions tagged .