3
$\begingroup$

I am very confused as to why the scatchard plot has a negative gradient. If the x axis shows increasing B, specific binding to a receptor, and on the y axis the specific binding (B)/concentration of ligand ([A]), then why is the gradient negatively sloped. Textbooks will assume that the concentration of ligand remains constant, so it seems intuitive that as you go along the x axis and increase the specific binding to the receptor, the gradient would be positively sloped, as values on the y-axis would also be taking greater values for the specific binding (as it is just B/[A]).

The only way that I can make this work would be that as B increases, then [A] will also have to increase so that overall B/[A] will decrease (and thus provide the negative gradient as seen on the plot) However this is also unintuitive as:

i)We assume that [A] is constant anyway and this is what most textbooks do

ii)Even if [A] can change, we would expect it to get smaller, as [A] represents the concentration of ligand, so as the number of bound receptors (B) rises, then we would think there would be fewer free ligands as they are binding to the receptor.

Any help understanding where I have gone wrong in this reasoning would be greatly appreciated, as I have clearly fundamentally misunderstood either the biology that this is seeking to model, or the mathematical model used to generate the graph.

$\endgroup$
2
  • $\begingroup$ Welcome to Biology.SE. The Biology.SE community has agreed that questions that show little or no prior research effort are off-topic on this site as are "homework" questions unless you have shown your attempt at an answer. Please edit your question and tell us where you've looked for answers, what you do know about the topic, and where exactly you still have questions. Under researched questions may be subject to down-voting and closure. Please take the tour and consult the help center starting with How to Ask for details. $\endgroup$
    – tyersome
    Commented Feb 12, 2022 at 21:00
  • 1
    $\begingroup$ I have now edited my question to include additional details. $\endgroup$
    – Ahmed
    Commented Feb 12, 2022 at 23:29

1 Answer 1

4
$\begingroup$

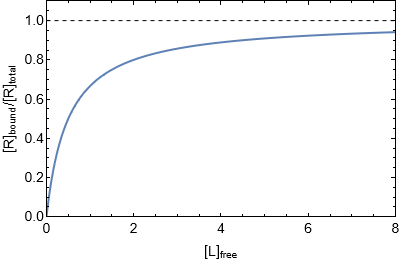
I think you probably misunderstand which quantities exactly are represented on the Scatchard plot. Let's start from the beginning. Binding between a receptor, $\mathrm R$, and a ligand, $\mathrm L$, can be described as an equilibrium reaction $$\ce{R + L <=> RL},$$ with the corresponding equilibrium constant $$K_{\mathrm{eq}} = \frac{[\ce{RL}]}{\ce{[R][L]}}.$$ For the simplicity, we have assumed that only one ligand binds to the receptor. Usually, we use the inverse equilibrium constant, called disociation constant $$K_{\mathrm d} = \frac{1}{K_{\mathrm{eq}}} = \frac{\ce{[R][L]}}{\ce{[RL]}}.$$ Both the ligand and the receptor can be either free or bound, but their total concentration remains constant. So we write $$\ce{[L]_{total} = \underbrace{[L]_{free}}_{[L]} + \underbrace{[L]_{bound}}_{[RL]}},$$ $$\ce{[R]_{total} = \underbrace{[R]_{free}}_{[R]} + \underbrace{[R]_{bound}}_{[RL]}}.$$ Let's first look at the fraction of occupied receptors, namely $\ce{[R]_{bound}/[R]_{total}}$ $$\ce{\frac{[R]_{bound}}{[R]_{total}} = \frac{[RL]}{[R]_{free} + [RL]}} = \frac{\frac{\ce{[L][R]}}{K_{\mathrm d}}}{\ce{[R]_{free}} +\frac{\ce{[L][R]}}{K_{\mathrm d}}} = \frac{\ce{[L]_{free}}}{K_{\mathrm d} + \ce{[L]_{free}}}.$$ This curve is probably familiar to you, and it is usually called saturation curve. It relates the concentration of free ligand with the fraction of occupied receptors.

Saturation curve

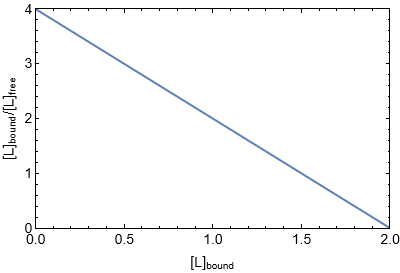
We are now interested in the ratio between bound and free ligand, $\ce{[L]_{bound}/[L]_{free}}$. Let's derive this quantity $$\ce{ [L]_{bound}} = \ce{[RL]} = \frac{\ce{[R][L]}}{K_{\mathrm d}} = \frac{\ce{[R]_{free}[L]_{free}}}{K_{\mathrm d}}, $$ $$ \ce{ \frac{[L]_{bound}}{[L]_{free}} } = \frac{\ce{[R]_{free}}}{K_{\mathrm d}}= \frac{\ce{[R]_{total}}-\ce{[R]_{bound}}}{K_{\mathrm d}} = \frac{\ce{[R]_{total}}}{K_{\mathrm d}} - \frac{\ce{[L]_{bound}}}{K_{\mathrm d}}. $$ We have obtained the Scatchard equation, relating the concentration of bound ligand with the ratio of bound and free ligand $$ \boxed{\ce{\color{red}{\frac{[L]_{bound}}{[L]_{free}} }} = \frac{\ce{[R]_{total}}}{K_{\mathrm d}} - \frac{\color{blue}{\ce{[L]_{bound}}}}{K_{\mathrm d}}}.$$

Scatchard plot

$\endgroup$
1
  • $\begingroup$ Thank you that makes much more sense $\endgroup$
    – Ahmed
    Commented Feb 16, 2022 at 21:03

You must log in to answer this question.

Not the answer you're looking for? Browse other questions tagged .