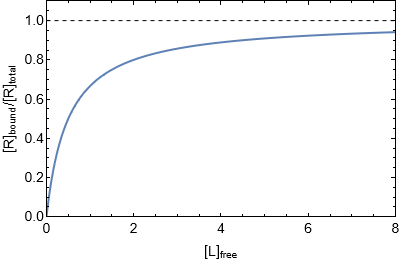
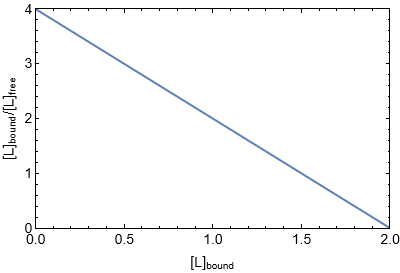
I am very confused as to why the scatchard plot has a negative gradient. If the x axis shows increasing B, specific binding to a receptor, and on the y axis the specific binding (B)/concentration of ligand ([A]), then why is the gradient negatively sloped. Textbooks will assume that the concentration of ligand remains constant, so it seems intuitive that as you go along the x axis and increase the specific binding to the receptor, the gradient would be positively sloped, as values on the y-axis would also be taking greater values for the specific binding (as it is just B/[A]).
The only way that I can make this work would be that as B increases, then [A] will also have to increase so that overall B/[A] will decrease (and thus provide the negative gradient as seen on the plot) However this is also unintuitive as:
i)We assume that [A] is constant anyway and this is what most textbooks do
ii)Even if [A] can change, we would expect it to get smaller, as [A] represents the concentration of ligand, so as the number of bound receptors (B) rises, then we would think there would be fewer free ligands as they are binding to the receptor.
Any help understanding where I have gone wrong in this reasoning would be greatly appreciated, as I have clearly fundamentally misunderstood either the biology that this is seeking to model, or the mathematical model used to generate the graph.


