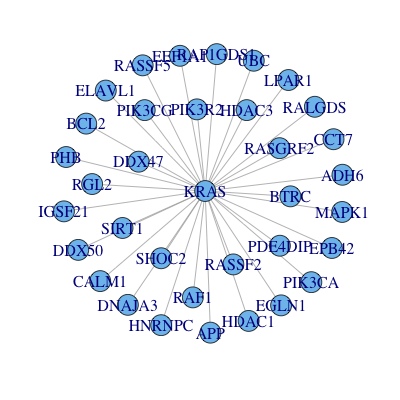
Assuming each gene symbol represents a unique gene or protein (this may not be true; see for gene name aliases in e.g. NCBI Entrez gene) you can get a lot of information programmatically. Below is an example using R and Bioconductor resources.
Define your list of genes:
# list of gene symbols, here we focus on one.
> genes <- "KRAS"
Load the annotation package org.Hs.eg.db and retrieve basic information including Gene Ontology ids:
# annotation package for human genes.
> library(org.Hs.eg.db)

# query Entrez gene id, description (GENENAME) and Gene Ontology id (GO)
> info <- select(org.Hs.eg.db, keys = genes, keytype = "SYMBOL", columns = c("ENTREZID", "GENENAME", "GO"))
> head(info)
  SYMBOL ENTREZID                                   GENENAME         GO EVIDENCE
1   KRAS     3845 Kirsten rat sarcoma viral oncogene homolog GO:0000165      TAS
2   KRAS     3845 Kirsten rat sarcoma viral oncogene homolog GO:0000186      TAS
3   KRAS     3845 Kirsten rat sarcoma viral oncogene homolog GO:0001934      IMP
4   KRAS     3845 Kirsten rat sarcoma viral oncogene homolog GO:0005515      IPI
5   KRAS     3845 Kirsten rat sarcoma viral oncogene homolog GO:0005525      IEA
6   KRAS     3845 Kirsten rat sarcoma viral oncogene homolog GO:0005737      IDA
  ONTOLOGY
1       BP
2       BP
3       BP
4       MF
5       MF
6       CC
Load the GO.db package and retrieve the term associated with the GO ids (this gives info about putative function):
> library(GO.db)
> info$Term <- Term(GOTERM[info$GO])
> head(info)
  SYMBOL ENTREZID                                   GENENAME         GO EVIDENCE
1   KRAS     3845 Kirsten rat sarcoma viral oncogene homolog GO:0000165      TAS
2   KRAS     3845 Kirsten rat sarcoma viral oncogene homolog GO:0000186      TAS
3   KRAS     3845 Kirsten rat sarcoma viral oncogene homolog GO:0001934      IMP
4   KRAS     3845 Kirsten rat sarcoma viral oncogene homolog GO:0005515      IPI
5   KRAS     3845 Kirsten rat sarcoma viral oncogene homolog GO:0005525      IEA
6   KRAS     3845 Kirsten rat sarcoma viral oncogene homolog GO:0005737      IDA
  ONTOLOGY                                           Term
1       BP                                   MAPK cascade
2       BP                   activation of MAPKK activity
3       BP positive regulation of protein phosphorylation
4       MF                                protein binding
5       MF                                    GTP binding
6       CC
Load the RefNet package and get information about interacting proteins:
> library(RefNet)
> refnet <- RefNet() # this step downloads from AnnotationHub and may take some time.
> int <- interactions(refnet, species = "9606", id = genes, provider = "BioGrid")
# create data.frame with Entrez id of proteins.
> d <- int[,1:2]
> d$A <- sub(".*locuslink:(.*)\\|.*", "\\1", d$A)
> d$B <- sub(".*locuslink:(.*)\\|.*", "\\1", d$B)
> head(d)
      A    B
1  3065 3845
2  8841 3845
3 23411 3845
4  1994 3845
5  3845 9770
6  9770 3845
Use the igraph package to visualize the interacting proteins.
> library(igraph)
> g <- igraph::simplify(graph.data.frame(d, directed = FALSE))

# annotate the nodes with the symbol.
> V(g)$label <- select(org.Hs.eg.db, keys = V(g)$name, columns = c("SYMBOL"), )$SYMBOL
> plot(g)

Then you could repeat the cycle with the interacting partners. There are many other things you can do, starting from a list of symbols; this is just a brief example. More detailed examples and workflows can be found here.

